Tariffs & LIFO Series: Part Two
In part one of LIFOPro’s three-part series on tariffs titled How to Use LIFO to Create Tax Benefits from Tariffs, we covered the basics about how LIFO works, why companies use the LIFO method, and why the subject of tariffs will likely drive meaningful, if not historic inflation and tax benefits for those who make first-time LIFO elections for the 2025 tax year. In this series, we’ll dive deeper into the mechanics behind LIFO, establish LIFOPro’s key performance indicators for measuring LIFO’s preferability and election timing, and the specifics regarding how recently imposed tariffs on goods imported into the U.S. will offer meaningful tax benefits for companies considering electing LIFO for the 2025 year end.
Current Tariff Environment
As of May 2025, the United States has implemented a series of significant tariff increases affecting a broad range of imported goods. Here is an overview of the current tariff landscape:
- Average Effective Tariff Rate: Currently stands at 17.8%, the highest since 1934. This reflects a substantial increase from pre-2025 levels, primarily due to recent policy changes.
- General Import Tariff: A 10% blanket tariff has been imposed on all imports, regardless of origin.
- Steel and Aluminum: Imports of steel and aluminum are subject to a 25% tariff across all countries.
- Tariffs on Chinese Imports
- Section 301 Tariffs: Additional duties ranging from 25% to 100% have been imposed on various Chinese goods under Section 301 actions.
- Temporary Reduction: As part of a recent truce, tariffs on Chinese imports have been temporarily reduced to a baseline of 30%, excluding certain existing duties.
- Tariffs on Mexican Imports
- General Tariff: A 25% tariff is applied to most Mexican goods.
- USMCA Exemptions: Goods that meet USMCA requirements continue to enter duty-free.
- Tariffs on Imported Vehicles and Auto Parts
- Passenger Vehicles: A 25% tariff has been imposed on imported passenger vehicles, effective April 3, 2025. This is in addition to the existing 2.5% base tariff, resulting in a total tariff of 27.5% for passenger cars from countries without a U.S. free trade agreement.
- Light Trucks: Light trucks from countries without a U.S. free trade agreement are subject to a 50% total tariff, combining the new 25% tariff with the existing 25% base tariff.
- Automotive Parts: A 25% tariff applies to imported automotive parts, effective May 3, 2025. This includes key components such as engines, transmissions, powertrains, and electrical systems.
- Tariffs on Japanese Imports: Japanese automobiles are currently subject to a total import tariff of 27.5%, which includes the existing 2.5% base tariff plus the 25% additional tariff imposed in April 2025.
- USMCA Exemptions: Vehicles and parts imported from Canada and Mexico that comply with the United States-Mexico-Canada Agreement (USMCA) rules of origin are exempt from these tariffs. However, the 25% tariff applies to the non-U.S. content in these imports.
Imports of Goods to U.S.
According to the U.S. International Trade Commission, $3.3 billion of commodities were imported into the United States in 2024. The top 20 countries importing goods into the United States is shown in Table 1 below.
Table 1. Top 20 Countries Importing Goods into United States, 2024
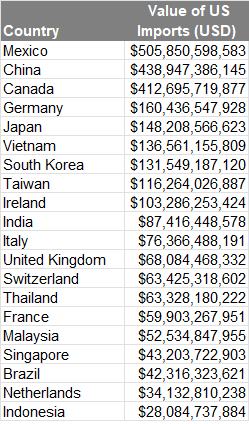
Source: U.S. International Trade Commission: DataWeb
The top imported goods by North American Industry Classification System Grouping is shown in Table 2 below, which also provides a breakout of the import value by the top five countries in terms of 2024 import value.
Table 2. 2024 Value of U.S. Imports by Selected North American Industry Classification System (NAICS) Grouping
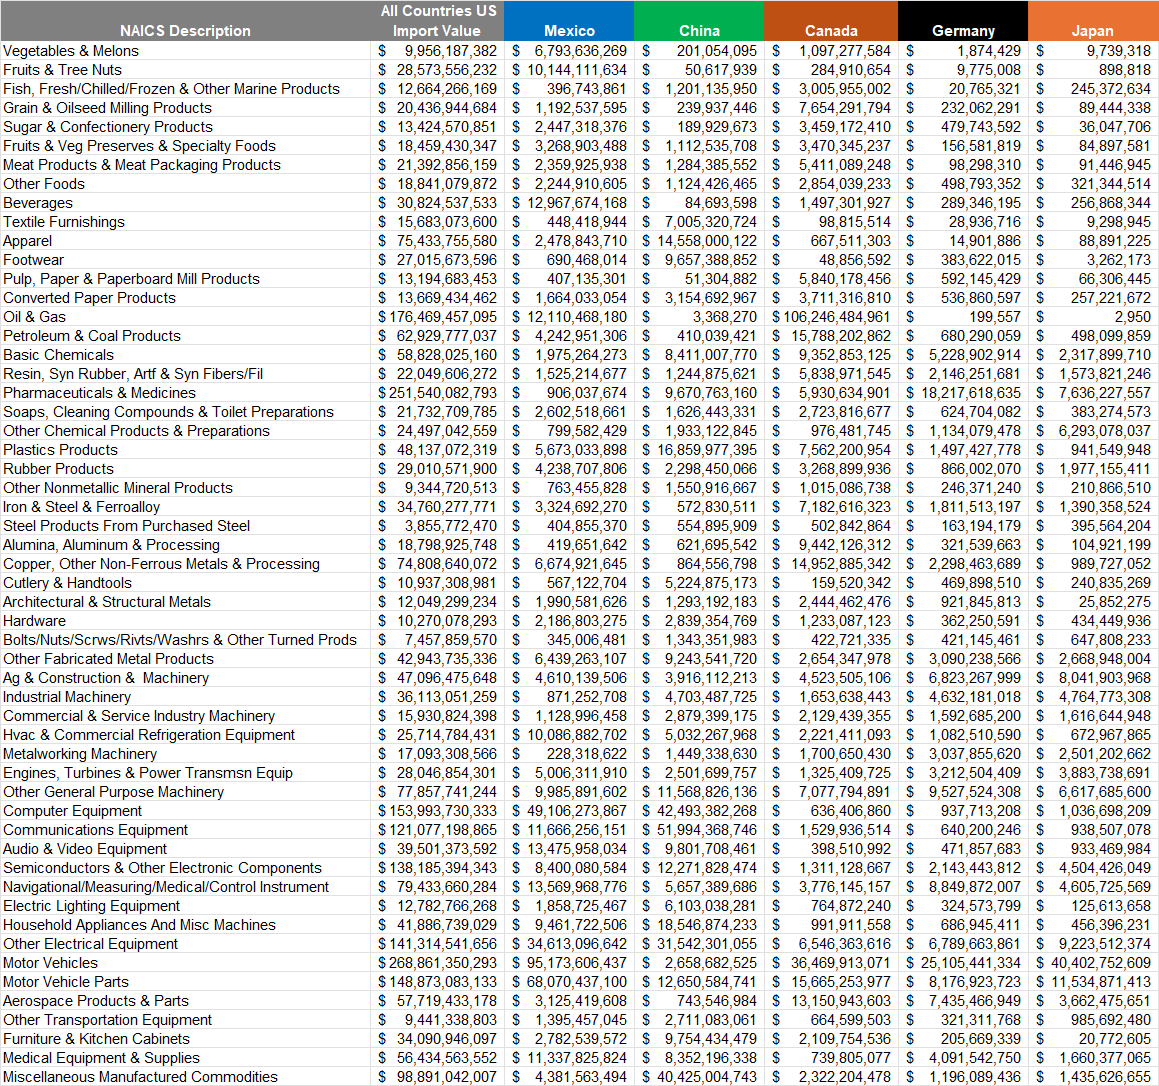
Source: U.S. International Trade Commission: DataWeb
Who Should Use LIFO & When Should the Election be Made?
LIFOPro has designed key performance indicators or KPIs to assist with scoping out LIFO elections. This allows for the rewards of LIFO to be weighed against the risks, for informed decisions to be made on the timing of the LIFO election, assists with choosing the submethods to be used and forecasting the future LIFO tax benefits. LIFO KPIs include:
- 20 year average annual inflation rate: Establishes whether LIFO is a preferable method
- 20 year inflation frequency rate: Forecasts price volatility and probability of future LIFO recapture
- Estimated 20 year LIFO reserve and average annual LIFO expense: Forecasts LIFO’s potential short/mid and long-term tax benefits
- Election Year LIFO Tax Benefit Multiplier: Assists with determining LIFO election timing as it shows how much higher/lower or comparable the current period LIFO tax benefits are vs. historical norms. Multiplier values indicate the following:
- Less than 1: Current year inflation & LIFO tax benefit is less than the historical average. LIFOPro recommends deferring a LIFO election when the multiplier is less than 1.
- Greater than or equal to 1: Current year inflation & LIFO tax benefit is more than the historical norms. LIFOPro recommends a LIFO election when the multiplier is ≥ 1.
The election year LIFO tax benefit multiplier provides an especially useful measure for gauging the best time to elect LIFO (i.e. if a LIFO election should be made in the current year, and how the tax benefits of electing LIFO compare to the historical averages). For example, an election year LIFO tax benefit multiplier of 5 would indicate that compared to the historical averages, five years worth of tax benefits will be achieved in the year of the LIFO election. Said another way, similar to delaying a purchase until the price is deeply discounted, companies should take advantage of electing LIFO in a period where the election year tax benefit multiplier is many times greater than 1. Furthermore, electing LIFO in a period where the tax benefits are much more than the historical averages also significantly lowers the probability of facing material LIFO recapture in the future.
For example, a company with a 10% current year inflation rate & a 2% 20 year average annual inflation rate would have a 5x LIFO tax benefit multiplier because the current year inflation and resulting tax benefit will be 10% ÷ 2% or five times higher than a normal or average period of inflation. To further illustrate, a company with a 1% current year inflation rate & a 2% 20 year average annual inflation rate would have a 0.5x LIFO tax benefit multiplier because the current year inflation and resulting tax benefit will be half of what it would be during a period of normal inflation. For CPA firms seeking to prioritize the resources committed towards LIFO tax planning, the LIFO election tax benefit multiplier provides an objective means of measuring the value or level of tax benefit from a current period LIFO election.
Which Industries Will Have the Biggest LIFO Tax Benefits from Tariffs in 2025?
The 2025 year-end will be an optimal period to elect LIFO for many industries considering the 20-year average annual inflation rate for the most predominant industries using LIFO is between 2% – 5%, and 10% baseline tariff rate is currently in place on most imported goods. This means that for many industries, the 2025 LIFO election tax benefit multiplier will be at least double the 20-year average annual inflation rate. Since tariffs on imported goods could potentially create record-high inflation rates in certain industries, the biggest LIFO tax benefits will likely occur within companies with the highest concentration of goods that are subject to tariffs, and those carrying goods with the highest tariff rates.
Shown below is LIFOPro’s table of the 2025 Top LIFO Election Candidates which includes the most recent inflation rates, historical averages and LIFOPro’s KPI’s. The
Table 3. LIFOPro’s 2025 Top LIFO Election Candidates
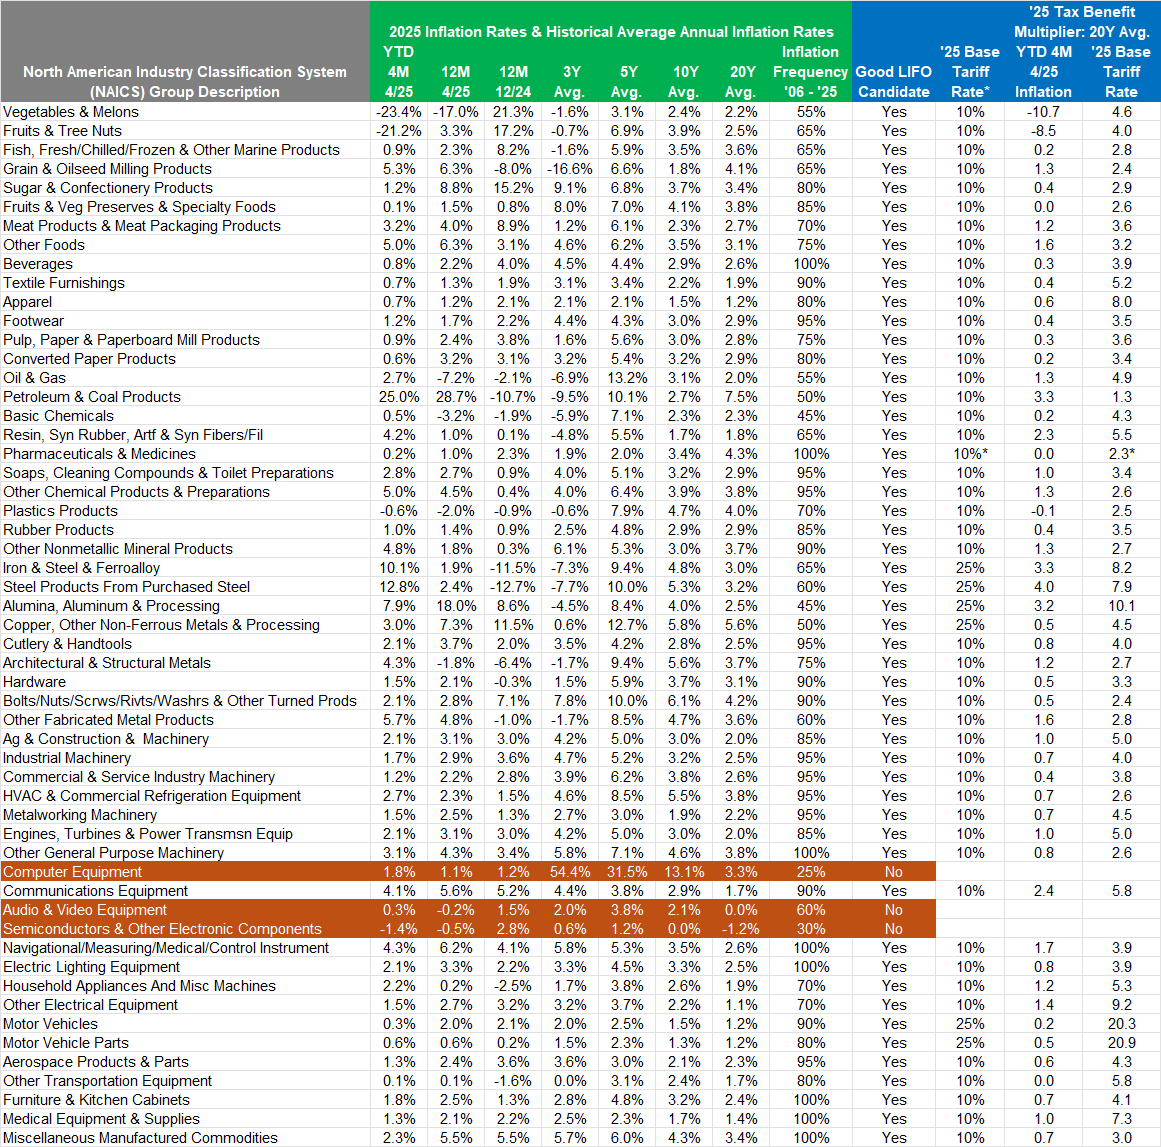
Source: Bureau of Labor Statistics Producer Price Index
How to Estimate LIFO Tax Benefits
From a tax perspective, LIFO is a straightforward concept in the sense that it reduces taxable income whenever there’s inflation (exception is if there’s a material liquidation in the current vs. prior year’s inventory balance). Furthermore, the amount of the tax benefit created from electing LIFO is fairly simple. The most common formulas used to estimate the election year tax benefits from LIFO are as follows:
- Election year taxable income reduction (aka LIFO expense): Prior year inventory balance * Current year inflation rate
- Election year tax benefit (tax liability reduction aka after-tax cash savings): Election year LIFO expense * combined federal + state tax rate (LIFO reduces both federal & state income tax liability)
Shown below are examples illustrating the tax benefits of LIFO assuming an election is being made for the 2025 year-end. All three scenarios assume a 10% inflation rate, 30% combined federal & state tax rate & 7.5% interest rate on debt. The first scenario assumes the 2025 year-end inventory balance was $1M higher than the 2024 year-end balance. The second scenario assumes the current vs. prior year inventory balance is unchanged, and the third scenario assumes a $1M year over year inventory decrease or reduction.
Figure 1.1 LIFO Tax Savings Example – 12/31/2025 Election
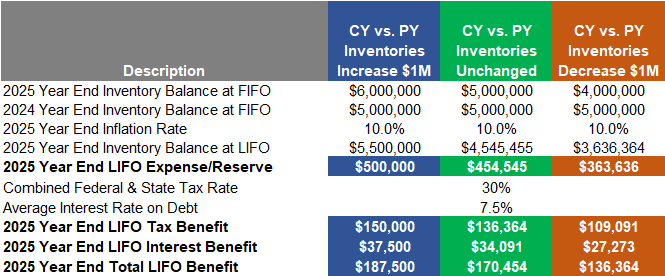
Figure 1.2 Suggested LIFO Journal Entry – 12/31/2025 Election
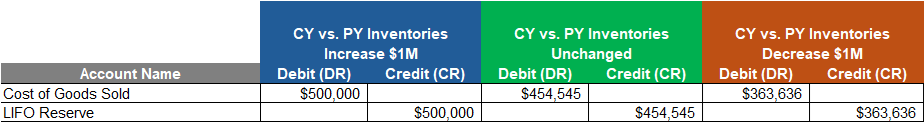
Note: Scenarios above showing Current vs. Prior year inventory balances remaining unchanged or decreasing shown to illustrate that a LIFO tax benefit can occur even when the current vs. prior year’s inventory balance at cost (FIFO, average cost) is the same or decreases. See LIFOPro’s Blog for further information on this subject: How LIFO Reserve Changes are Calculated
Since most companies continue using the LIFO method subsequent to the initial period of adoption, it’s important to establish mid and long-term forecasts of the effect of LIFO prior to adoption. Furthermore, doing so allows one to understand both the risks and rewards of the LIFO method. For example, when deflation occurs, LIFO will typically increase rather than decrease taxable income, and when this occurs, a portion of the LIFO tax benefits will be recaptured into income. Since this is the case, performing or obtaining LIFO benefit analysis that provides a forecast of the effect of deflation in future periods as well as the potential frequency and size of future LIFO recapture is extremely valuable for planning and risk assessment purposes.
The two examples provided below are 20-year forecasts of a company’s LIFO reserve beginning with the 2025 year-end using the company’s product mix as of that same period year end and historical inflation rates from the each of the past 20 years (2006 – 2025). Both examples assume a 20-year average annual inflation rate of about 2%, and an inflation frequency rate of 80% (inflation was measured in 16 of 20 years). As seen below, deflation occurred in 2026, 2032, 2039 and 2042, and in all four of those periods, LIFO income (LIFO reserve decrease) occurred during those periods. Despite this occurring, the company’s LIFO reserve grew exponentially over the 20-year period, and the four periods of deflation were fairly insignificant in comparison to the overall LIFO reserve increase that occurred during the 20-year period.
Figure 3 assumes that inventory balances change at about the same pace of inflation during the 20-year period. Figure 4 assumes that inventory balances remain the same over the 20-year period. Both examples are provided to illustrate an important point that the LIFO reserve will continue to increase even if inventory balances remain the same over a long period of time (common misconception is that the LIFO reserve can only grow when inventory balances grow, which is not true). Also included below each table are breakdowns of the of the annual outsourcing fee paid to have a third party such as LIFOPro manage all aspects of the company’s LIFO calculation, which is provided for purposes of measuring the benefits vs. costs and return on investment from LIFO.
Figure 3. LIFO Tax Savings Example – 20 Year Projection: YOY Inventory Balances Increase
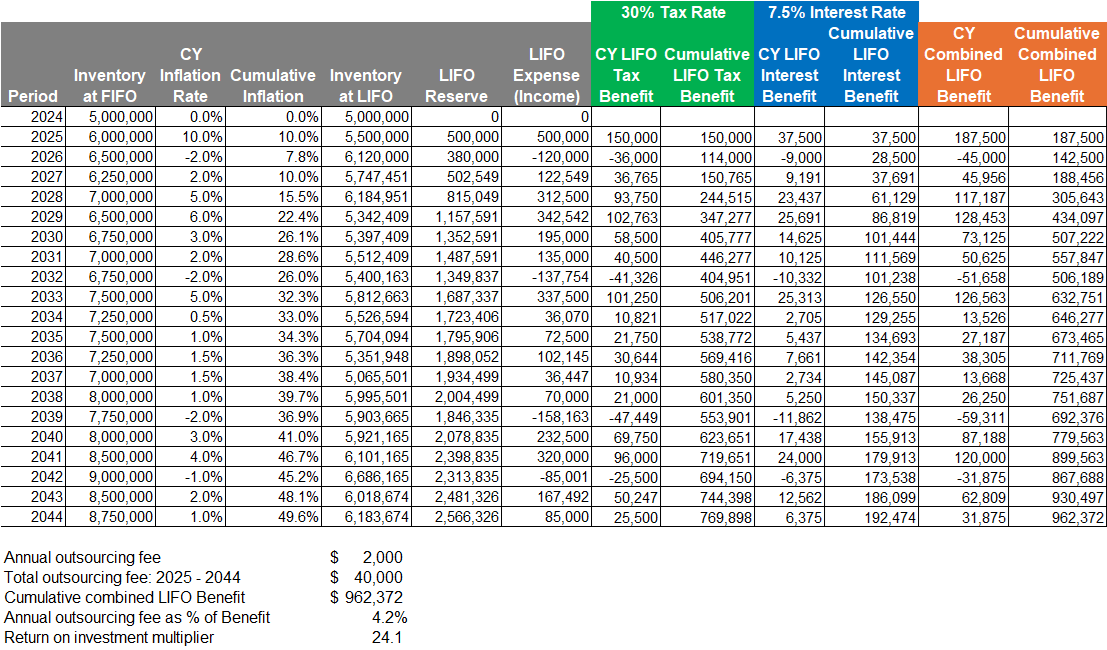
Figure 4. LIFO Tax Savings Example – 20 Year Projection: YOY Inventory Balances Constant
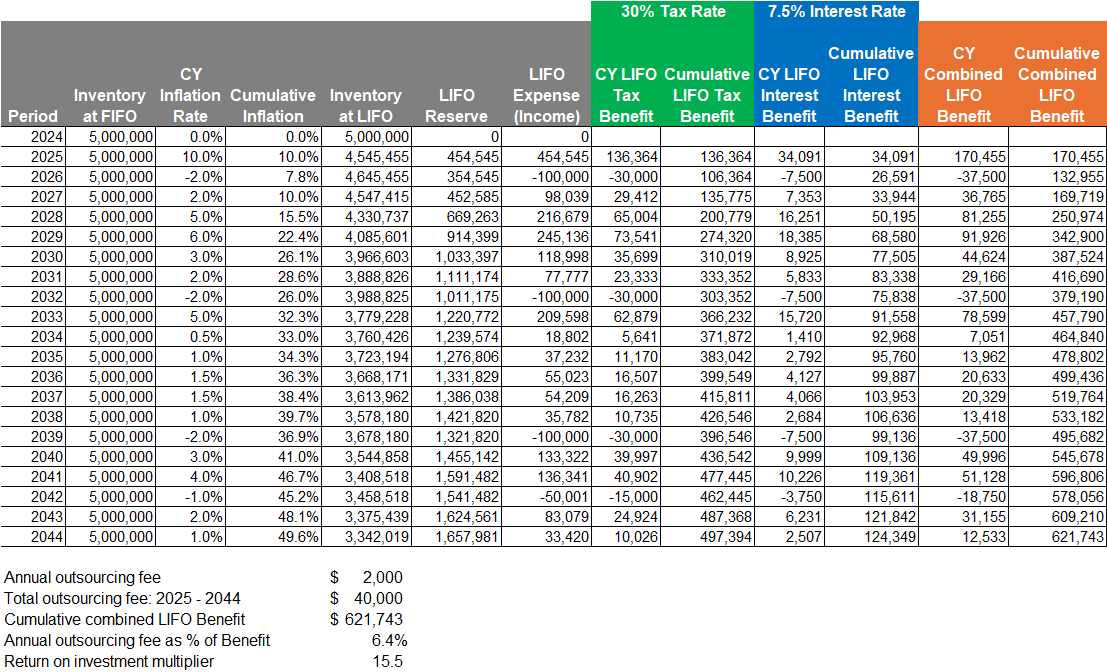
Note: Figure 4 shown to illustrate that a LIFO tax benefit can occur even when the inventory balance at cost (i.e. FIFO, average cost) remains stays the same over a long period of time (same would occur if inventory balances decreased over a long period of time as opposed to staying the same or increasing, but total LIFO tax benefit would be less).
Key Takeaways
- New tariffs imposed on goods imported into U.S. will likely create above average inflation & tax benefits from electing LIFO in 2025
- LIFO Key performance indicators or KPIs provide powerful insights for companies and CPA firms exploring LIFO elections
- The most ideal time to elect LIFO is when the tax benefits are greater than or equal to the historical averages
- Thorough benefit analysis should be performed prior to adopting to establish the preferability of LIFO, assessing rewards vs. risks, estimate current year LIFO tax benefit, forecast future tax benefits and determine the best time to elect LIFO
Actionable Items
- Follow part one and three of our series on tariffs & LIFO
- Learn more about LIFO by scheduling a discovery call with the LIFOPro team
- Explore a LIFO election by obtaining a complimentary LIFO election benefit analysis from LIFOPro