LIFOPro's 2025 LIFO Opportunities & Strategies PDF Guide
LIFOPro's 2025 Top LIFO Election Candidates List & Tax Benefits Calculator Excel File
2025 CPA Firm LIFO Election Scoping Guide
During periods of inflation, the LIFO method is most clearly reflective of income because it most closely matches current costs with current revenues. Mechanically speaking, when costs are rising, LIFO charges the inflationary component of ending inventory to cost of goods sold (lowers ending inventory & raises COGS). As a result, LIFO removes artificial profits created from price inflation, which in turn reduces federal and state income tax payments.


The LIFO method (last-in, first-out) is the most beneficial inventory-based tax savings strategy because it uses inflation to reduce taxable income, which in turn increases cash flow. Because of this, tens of thousands of companies use the LIFO method. There are many reasons to use the LIFO method, which include the following:

View/download LIFOPro’s 2025 Top LIFO Election Candidates & Tax Benefit Calculator Excel file by clicking this link: LIFOPro’s 2025 Top LIFO Election Candidates & Tax Benefit Calculator
The illustration below shows the effect of tariffs on the inflation calculation & the resulting LIFO tax benefit.


Key performance indicators or KPIs provide a reasonable means of determining the following:
The KPIs listed below allow for objective metrics to be used to weigh LIFO’s risks and rewards and costs vs. benefits and should be considered an integral component of the LIFO election scoping process:
LIFOPro’s complimentary benefit analysis uses the above KPIs to assist in the LIFO election scoping process.
The costing method used to value inventory is considered an accounting method or principle. Because of this, companies issuing GAAP financial statements must establish that LIFO is preferable to the existing method.
LIFOPro uses a scoring system & the following criteria to perform preferability testing:
LIFOPro measures the two above criteria by assigning Bureau of Labor Statistics Consumer/Producer Price Indexes (BLS CPI/PPI) to product mix on hand at the time of potential LIFO election & performing a 20 year pro forma LIFO calculation. Meeting both of the above criteria is sufficient justification to establish LIFO as a preferable method.. Companies meeting both of the above criteria should explore a LIFO election; those that don’t should not since LIFO is not preferable.
LIFO creates a tax benefit when there’s inflation but creates a tax liability when there’s deflation. The LIFO tax benefit amount is dependent on the amount of inflation measured in the year of election (prior or future period inflation can’t be used!). Because of the two above facts, LIFOPro requires 1 or both of the following election timing KPIs to recommend a current year election:
LIFOPro’s scoring system described above system & scoring criteria are integrated into LIFOPro’s 2025 Top LIFO Election Candidates Tables shown below. They’re also integrated in our complimentary LIFO election benefit analysis reports prepared for companies who aren’t on LIFO but are considering adoption.
The simple answer is NO! With that being said, there are two options for how goods are to be tracked using LIFO:


When the dollar-value LIFO method is used, accounting functions such as purchases and sales are tracked and recorded in the accounting system the same way they were prior to the LIFO election. Item costs are never tracked on a LIFO basis under this method. Instead, LIFO is accounted for as a top-side journal entry at year end. The inventory physical cost flow activity and year end inventory balances are illustrated above for a company making a first-time LIFO election for the 2025 year end. Shown below are three illustrations of how the year end LIFO calculation occurs outside of the accounting information system under the dollar-value LIFO method. The first illustration shows how inflation is calculated. The second illustration shows the calculation of the LIFO inventory value, LIFO reserve and LIFO expense. The third and fourth illustrations show how LIFO is accounted for as a top-side adjusting journal entry.


LIFO is applied prospectively beginning in the year of election, and the election year LIFO tax benefit is calculated based on the annual inflation rate measured as of the year end date. For example, a December year end company electing LIFO for the 12/31/2025 year end will measure the annual inflation rate by comparing CY or 12/31/25 & PY or 12/31/24 costs.
Tariffs will create a one-time increase to inflation in the first period they’re incurred if the same tariff rate is in effect for two consecutive periods. Companies seeking to capture the tariff component of the tax benefit must elect LIFO in the first period the initial or increased tariff costs are incurred. Events such as tariffs or high inflation periods represent the best time to elect LIFO because the first year tax benefits will be exponentially higher than they would be when electing during a normal inflation period. A comparison of the taxable income reduction & resulting tax benefits from electing LIFO during a high vs. normal inflation period is illustrated below.


As seen above, a company with $10M in inventory electing LIFO in a high inflation period (2025) had a total LIFO tax benefit of $569K after its fifth year on LIFO. Assuming that same company waited until the following year to elect LIFO during a normal inflation period (2026), the total LIFO tax benefit after its fifth year on LIFO was $172K, which is about one third of the total LIFO tax benefit obtained when electing during a high inflation period.
Although LIFO typically provides material long-term tax benefits, there are certain events that can trigger taxable income when using the LIFO method. Those are as follows:
Events such as deflation are inevitable in certain industries, but rarely occur in others. Accordingly, understanding the historical inflation frequency is a key consideration to take into account when considering a LIFO adoption. For example, steel mill products have a 60% inflation frequency rate over the last 20 years, which infers that inflation has occurred in 12 of the last 20 years, and deflation has occurred in 8 of the last 20 years. Knowing this, there’s a high likelihood that deflation will occur every few years in industries such as steel mill products, which will cause taxable income to be created in the deflationary periods.
Some view the use of the LIFO method to be a deferral or delay of income tax payments and assume recapture to be an inevitable event. Others perceive LIFO to create a quasi-permanent tax benefit if one were to assume the continued use of the LIFO method in perpetuity. Regardless of one’s view of LIFO, there are selected events that are certain to cause complete recapture of the LIFO reserve into taxable income, such as the ones listed above. Knowing this, it’s important to keep the following in mind:
The following inflation calculation approaches are available when using the dollar-value LIFO method:
Many companies use the IPIC method for the following reasons:
Some companies use internal indexes for the following reasons:
The effects of tariffs on inflation & LIFO tax benefits are dependent on inflation measurement source:
The effect of tariffs on the 2025 LIFO tax benefit can be materially different when using an internal vs. external inflation index. With this in mind, it’s imperative to consider all options available prior to adopting LIFO to ensure the methods elected maximize tax benefits. LIFOPro’s complimentary benefit analysis includes comparative internal and external inflation index calculations and submethods recommendations.
Some or all goods can be valued using LIFO. A selective election scope infers that less than 100% of inventories are valued using the LIFO method. Although a general rule of thumb is to place all goods on LIFO to maximize the tax benefit, thorough analysis is highly recommended prior to electing LIFO. This is because including deflationary goods in the election scope could materially reduce LIFO’s long-term tax benefits. LIFOPro’s best practices regarding determining the LIFO election scope is described below.
Some or all goods can be valued using LIFO. A selective election scope infers that less than 100% of inventories are valued using the LIFO method. Although a general rule of thumb is to place all goods on LIFO to maximize the tax benefit, thorough analysis is highly recommended prior to electing LIFO. This is because including deflationary goods in the election scope could materially reduce LIFO’s long-term tax benefits. LIFOPro’s best practices regarding determining the LIFO election scope is described below.
Updated 02/09/2026 with December 2025 Producer Price Indexes (October – December PPI releases were delayed due to government shutdown)
In 2025, tariffs have created elevated inflation in most industries when compared to the historical averages. As a result, most companies can obtain material tax benefits from electing LIFO this year. The current average effective tariff rate on U.S. imported goods is 18%, which is nearly 7x higher than the 2024 average effective tariff rate of 2.5%.
The most notable LIFO election opportunities from a tax benefits perspective are summarized below by Bureau of Labor Statistics Producer Price Index (BLS PPI) group. The 2025 annualized inflation rates are listed below.
LIFOPro’s Top LIFO Election Candidates list is published annually to enable LIFO election scoping to be seamlessly integrated into year end tax planning (LIFO election scoping is commonly known as LIFO election benefit analysis). To minimize the time and effort required by CPA firms and companies to complete the LIFO election scoping process, we utilize proprietary KPIs and government inflation data to provide objective assessments on the preferability of LIFO and the timing of the election, and to estimate current and future LIFO tax benefits. CPA firms and companies can quickly accomplish the following using LIFOPro’s 2025 Top LIFO Election Candidates List:
Our list is built upon the Bureau of Labor Statistics Producer Price Index (BLS PPI) groupings. They are an accurate and credible source for quickly measuring LIFO’s preferability, election timing and estimated tax benefits because many companies use these same indexes to perform the required LIFO inflation calculations, and the use of BLS PPIs for LIFO purposes is widely accepted by the IRS. It is organized into the following four tables (shown below):
Our list includes the following content for each Bureau of Labor Statistics Producer Price Index (BLS PPI) group:
Download LIFOPro’s 2025 Top LIFO Election Candidates List & Tax Benefit Calculator Tool Excel File: LIFOPro’s 2025 Top LIFO Election Candidates List & Tax Benefit Calculator


LIFOPro offers complimentary election benefit analysis that provides a comprehensive assessment of the risks and rewards of LIFO using your client’s or company’s actual inventory data. Prior to obtaining this analysis, many of our CPA firm partners will perform a high-level benefit analysis because it acts as a pre-screening tool to confirm that LIFO election scoping should occur, and it provides meaningful metrics that can be shared with the client when preliminary discussions occur with them about LIFO. To do so for a single client, take the following steps:
Instructions:
Note: LIFO is adopted on a prospective basis & LIFO tax savings accrue beginning in the year of the change. Prior period benefits can NOT be retrospectively recaptured. Forecasted tax benefits are for analysis purposes only & is provided to project the potential tax savings from LIFO based on your prior year end inventory balance & historical average inflation rates.
LIFOPro’s Tax Benefits Calculator quickly pre-screens companies to determine if further LIFO election scoping should occur & calculates high-level cost-benefit estimates during the preliminary stages of the LIFO election scoping process. Usage steps are as follows:
BLS PPI Annual Inflation Rate Averages Table for Selected Commodities Through November 2025
| PPI Code | BLS PPI Category Description | 1M 11/25 | YTD 11/25 | 1YR 11/25 | 3YR 11/25 | 5Y 11/25 | 10YR 11/25 | 20Y 11/25 |
|---|---|---|---|---|---|---|---|---|
| 01 | FARM PRODUCTS | 3.5% | -0.6% | -0.5% | -4.1% | 6.5% | 3.6% | 3.5% |
| 011 | Fruits & melons, fresh/dry vegs. & nuts | 5.9% | 2.8% | 10.3% | -7.8% | 5.5% | 3.3% | 3.8% |
| 012 | Grains | -10.7% | -7.9% | 6.4% | -16.5% | -0.8% | 1.4% | 3.6% |
| 013 | Slaughter livestock | 15.1% | 17.8% | -9.6% | 17.3% | 16.2% | 6.5% | 5.0% |
| 014 | Slaughter poultry | 1.2% | -12.1% | -0.7% | -4.9% | 8.3% | 4.1% | 3.1% |
| 015 | Raw cotton | -14.0% | -6.5% | 1.1% | -10.9% | -0.8% | 0.1% | 1.1% |
| 016 | Raw milk | 6.3% | -19.3% | -7.2% | -12.2% | 0.6% | 1.3% | 1.1% |
| 017 | Chicken eggs | 42.2% | -46.8% | 6.2% | -17.0% | 14.4% | 1.3% | 5.7% |
| 018 | Hay, hayseeds and oilseeds | -7.6% | 13.6% | 14.6% | -7.9% | 0.4% | 2.8% | 3.4% |
| 02 | PROCESSED FOODS AND FEEDS | 4.1% | 2.7% | -0.2% | 1.5% | 5.1% | 2.9% | 3.0% |
| 021 | Cereal and bakery products | 5.2% | 0.5% | 0.0% | 0.4% | 5.0% | 2.9% | 3.1% |
| 022 | Meats, poultry, and fish | 2.0% | 9.3% | -0.1% | 5.2% | 7.3% | 3.4% | 3.2% |
| 023 | Dairy products | 3.2% | -4.3% | -0.9% | -2.6% | 1.6% | 1.5% | 2.0% |
| 024 | Processed fruits and vegetables | 9.3% | 2.9% | -0.2% | 4.5% | 7.0% | 4.3% | 3.8% |
| 025 | Sugar and confectionery | 10.1% | -0.8% | -1.3% | 6.7% | 6.4% | 3.4% | 3.2% |
| 026 | Beverages and beverage materials | 5.8% | 4.2% | -0.2% | 3.6% | 5.0% | 3.2% | 2.7% |
| 027 | Fats and oils | -4.6% | 2.1% | -2.2% | -8.9% | 5.1% | 3.1% | 3.0% |
| 028 | Miscellaneous processed foods | 6.6% | 1.4% | 0.3% | 1.0% | 5.4% | 2.8% | 2.9% |
| 029 | Prepared animal feeds | 1.0% | -1.6% | 0.3% | -4.4% | 2.5% | 2.1% | 3.5% |
| 03 | TEXTILE PRODUCTS AND APPAREL | 2.4% | 3.2% | 0.2% | 0.8% | 5.1% | 2.9% | 2.2% |
| 031 | Synthetic fibers | 2.2% | 0.2% | -0.2% | 0.1% | 5.8% | 3.3% | 1.9% |
| 032 | Processed yarns and threads | 0.0% | 2.4% | 0.9% | -1.7% | 5.8% | 3.0% | 2.4% |
| 033 | Greige fabrics | 2.7% | 5.5% | 0.2% | 1.4% | 5.3% | 2.5% | 2.1% |
| 034 | Finished fabrics | 2.6% | 4.1% | 0.3% | 0.9% | 5.2% | 3.3% | 2.6% |
| 038 | Apparel & other fabricated textile prods | 3.2% | 4.0% | 0.0% | 2.9% | 4.1% | 2.5% | 2.1% |
| 039 | Miscellaneous textile products/services | 2.1% | 2.5% | 0.0% | -5.1% | 7.0% | 2.6% | 1.9% |
| 05 | FUELS AND RELATED PRODUCTS AND POWER | -0.6% | 2.4% | 1.7% | -5.9% | 7.5% | 3.9% | 1.0% |
| 051 | Coal | 14.7% | 0.2% | -0.3% | -2.5% | 8.3% | 4.3% | 4.7% |
| 053 | Gas fuels | -13.7% | -20.7% | 4.9% | -16.0% | -0.4% | 0.7% | -6.6% |
| 055 | Utility natural gas | -2.9% | 6.3% | 5.0% | -0.8% | 5.2% | 5.0% | 0.2% |
| 056 | Crude petroleum (domestic production) | 0.5% | -12.4% | -1.1% | -11.5% | 9.2% | 3.9% | 0.5% |
| 057 | Petroleum products, refined | -3.2% | 4.6% | 5.1% | -12.1% | 10.7% | 4.6% | 1.8% |
| 058 | Asphalt and other petroleum and coal products, n.e.c. | -9.4% | 23.7% | -11.3% | -5.7% | 8.0% | 4.4% | 6.5% |
| 06 | CHEMICALS AND ALLIED PRODUCTS | -0.7% | 1.2% | -0.2% | -1.6% | 4.3% | 2.9% | 2.9% |
| 061 | Industrial chemicals | -4.5% | -1.4% | -0.8% | -5.4% | 5.1% | 2.2% | 2.1% |
| 062 | Paints and allied products | 5.6% | 4.3% | 0.8% | 0.8% | 6.9% | 4.7% | 3.9% |
| 063 | Drugs and pharmaceuticals | 2.4% | 0.8% | 0.1% | 2.1% | 2.2% | 3.1% | 4.2% |
| 064 | Fats and oils, inedible | -0.3% | 15.5% | -2.2% | -2.1% | 12.8% | 7.9% | 4.9% |
| 065 | Agricultural chemicals and chemical products | -4.3% | 9.9% | 0.7% | -6.5% | 7.7% | 3.3% | 3.3% |
| 066 | Plastic resins and materials | -5.8% | -2.0% | -0.8% | -3.7% | 2.8% | 1.6% | 1.0% |
| 067 | Other chemicals and allied products | 4.6% | 3.1% | 0.1% | 2.3% | 5.3% | 3.2% | 2.8% |
| 07 | RUBBER AND PLASTIC PRODUCTS | 2.3% | 0.6% | -0.1% | -0.2% | 5.5% | 3.3% | 2.6% |
| 071 | Rubber and rubber products | 4.1% | 2.2% | 0.0% | 1.3% | 5.2% | 2.9% | 2.8% |
| 072 | Plastic products | 1.8% | 0.1% | -0.1% | -0.6% | 5.6% | 3.4% | 2.6% |
| 08 | LUMBER AND WOOD PRODUCTS | -2.0% | -0.5% | 0.1% | -1.6% | 2.3% | 3.1% | 2.2% |
| 081 | Lumber | -8.5% | -2.0% | 0.0% | -1.6% | -0.4% | 2.9% | 1.5% |
| 082 | Millwork | 1.9% | -0.1% | 0.2% | -1.1% | 4.5% | 4.1% | 2.9% |
| 083 | Plywood | -2.3% | -0.2% | 0.7% | -3.8% | 0.5% | 3.2% | 2.0% |
| 084 | Other wood products | -0.6% | 1.2% | -0.2% | -1.9% | 3.1% | 2.8% | 2.0% |
| 085 | Logs, bolts, timber, pulpwood, woodchips and other roundwood products | -0.6% | -0.1% | -0.3% | -2.1% | 1.3% | 0.9% | 1.4% |
| 086 | Prefabricated wood buildings & components | 2.2% | 4.2% | 0.2% | 1.6% | 7.0% | 5.2% | 3.3% |
| 087 | Treated wood and contract wood preserving | 4.0% | -7.0% | 0.2% | -1.5% | 2.2% | 2.6% | 2.2% |
| 09 | PULP,PAPER, AND ALLIED PRODUCTS | 3.5% | 1.0% | -0.2% | 0.9% | 5.5% | 3.3% | 2.6% |
| 091 | Pulp, paper, and prod., ex. bldg. paper | 2.8% | 1.0% | -0.3% | 0.5% | 5.6% | 3.1% | 2.8% |
| 092 | Building paper & building board mill prods. | -5.4% | -25.5% | -0.2% | -11.5% | -6.6% | 2.0% | 1.6% |
| 094 | Publications, printed matter & printing material | 6.5% | 3.7% | -0.1% | 3.3% | 6.6% | 3.9% | |
| 10 | METALS AND METAL PRODUCTS | -2.5% | 10.2% | 0.4% | 3.1% | 8.4% | 5.9% | 3.6% |
| 101 | Iron and steel | -12.3% | 5.5% | -2.2% | -2.4% | 7.9% | 5.8% | 2.8% |
| 102 | Nonferrous metals | 1.9% | 22.6% | 2.6% | 10.0% | 9.3% | 7.6% | 4.6% |
| 103 | Metal containers | 4.1% | 6.8% | -0.2% | 1.1% | 8.1% | 4.9% | 3.3% |
| 104 | Hardware | 2.2% | 6.2% | 0.2% | 2.7% | 6.0% | 3.8% | 2.9% |
| 105 | Plumbing fixtures and fittings | 3.7% | 5.5% | 0.0% | 2.8% | 4.4% | 3.3% | 3.0% |
| 106 | Heating equipment | 5.0% | 7.1% | 0.0% | 4.1% | 8.6% | 5.6% | 4.4% |
| 107 | Fabricated structural metal products | 2.1% | 7.7% | 0.7% | 2.4% | 10.6% | 6.3% | 4.1% |
| 108 | Miscellaneous metal products | 4.3% | 3.2% | 0.2% | 2.7% | 6.0% | 3.7% | 2.7% |
| 11 | MACHINERY AND EQUIPMENT | 5.2% | 4.9% | 0.2% | 3.9% | 5.5% | 3.3% | 2.2% |
| 111 | Agricultural machinery and equipment | 4.9% | 1.5% | 0.0% | 1.3% | 6.1% | 3.9% | 3.1% |
| 112 | Construction machinery and equipment | 5.5% | 5.2% | 0.0% | 4.4% | 6.4% | 4.0% | 3.2% |
| 113 | Metalworking machinery and equipment | 5.6% | 4.6% | 0.0% | 4.6% | 5.7% | 3.5% | 2.6% |
| 114 | General purpose machinery and equipment | 7.3% | 7.3% | 0.2% | 5.4% | 7.9% | 5.0% | 3.9% |
| 115 | Electronic computers and computer equipment | 55.5% | 4.6% | 0.1% | 55.9% | 32.2% | 13.7% | 3.6% |
| 116 | Special industry machinery and equipment | 5.7% | 3.9% | 0.1% | 3.6% | 6.7% | 4.1% | 2.7% |
| 117 | Electrical machinery and equipment | 3.9% | 4.5% | 0.4% | 3.2% | 4.3% | 2.5% | 1.3% |
| 118 | Miscellaneous instruments | 6.1% | 6.4% | 0.1% | 5.2% | 5.6% | 3.7% | 2.7% |
| 119 | Miscellaneous machinery | 4.5% | 2.2% | 0.1% | 3.1% | 4.0% | 2.4% | 2.2% |
| 12 | FURNITURE AND HOUSEHOLD DURABLES | 3.4% | 4.2% | 0.1% | 2.4% | 5.1% | 3.4% | 2.5% |
| 121 | Household furniture | 2.6% | 3.4% | 0.0% | 1.5% | 4.8% | 3.3% | 2.7% |
| 122 | Commercial furniture | 5.8% | 4.7% | -0.1% | 3.3% | 6.9% | 4.6% | 3.3% |
| 123 | Floor coverings | 0.2% | 3.8% | 2.3% | 1.5% | 2.4% | 1.7% | 1.9% |
| 124 | Household appliances | 2.5% | 4.2% | 0.0% | 1.8% | 3.9% | 2.8% | 2.0% |
| 125 | Home electronic equipment | 3.1% | 5.5% | 0.0% | 2.7% | 4.7% | 2.7% | 0.3% |
| 126 | Other household durable goods | 3.7% | 4.6% | -0.2% | 3.5% | 5.4% | 3.2% | 2.4% |
| 13 | NONMETALIC MINERAL PRODUCTS | 7.3% | 2.7% | 0.1% | 3.9% | 6.5% | 4.4% | 3.7% |
| 131 | Glass | 4.2% | 2.5% | -0.1% | 1.9% | 4.7% | 3.3% | 2.3% |
| 132 | Concrete ingredients and related products | 9.2% | 4.6% | -0.2% | 6.7% | 7.3% | 5.5% | 4.5% |
| 133 | Concrete products | 8.5% | 1.7% | 0.1% | 4.6% | 7.2% | 5.1% | 3.9% |
| 134 | Clay construction products ex. refractories | 4.6% | 1.6% | 0.0% | 2.0% | 4.2% | 2.6% | 1.8% |
| 135 | Refractories | 5.2% | 1.7% | 0.0% | 2.4% | 4.8% | 3.6% | 3.7% |
| 136 | Asphalt felts and coatings | 6.8% | 1.4% | -0.1% | 1.8% | 6.6% | 4.5% | 4.6% |
| 137 | Gypsum products | 6.5% | 0.7% | 0.0% | 1.4% | 7.9% | 5.3% | 3.5% |
| 138 | Glass containers | 9.1% | 1.5% | 0.0% | 5.3% | 7.1% | 4.3% | 3.6% |
| 139 | Other nonmetallic minerals | 6.3% | 3.6% | 0.3% | 3.2% | 6.0% | 3.4% | 3.7% |
| 14 | TRANSPORTATION EQUIPMENT | 2.7% | 2.0% | 0.2% | 2.0% | 2.8% | 1.8% | 1.7% |
| 141 | Motor vehicles and equipment | 2.3% | 2.0% | 0.3% | 1.5% | 2.8% | 1.7% | 1.5% |
| 142 | Aircraft and aircraft equipment | 3.9% | 2.0% | 0.1% | 3.2% | 3.0% | 2.1% | 2.3% |
| 143 | Ships and boats | 3.3% | 2.9% | 0.0% | 2.6% | 3.6% | 2.5% | 2.4% |
| 144 | Railroad equipment | 0.2% | 1.0% | 0.0% | 0.9% | 1.3% | 0.7% | 1.5% |
| 149 | Transportation equipment, n.e.c. | 1.8% | 1.1% | 0.0% | 0.4% | 3.3% | 2.5% | 1.8% |
| 15 | MISCELLANEOUS PRODUCTS | 6.5% | 5.6% | 0.4% | 5.5% | 6.3% | 4.5% | 3.3% |
| 151 | Toys, sporting goods, small arms, etc. | 6.4% | 1.5% | 0.0% | 3.8% | 6.1% | 3.4% | 2.6% |
| 152 | Tobacco products, incl. stemmed & redried | 11.1% | 10.5% | 0.8% | 10.9% | 10.3% | 8.2% | 6.5% |
| 154 | Photographic equipment and supplies | 4.6% | 3.1% | -3.2% | 3.1% | 4.6% | 3.3% | 2.6% |
| 155 | Mobile homes | 1.6% | 4.7% | 3.8% | 0.9% | 7.4% | 6.4% | 4.6% |
| 156 | Medical, surgical & personal aid devices | 3.0% | 2.6% | 0.2% | 2.5% | 2.6% | 1.8% | 1.4% |
| 157 | Other industrial safety equipment | 6.0% | 5.4% | 1.1% | 4.1% | 6.2% | 3.4% | 2.7% |
| 159 | Other miscellaneous products | 7.1% | 5.4% | 0.3% | 4.6% | 7.1% | 4.8% | 3.2% |
BLS CPI Historical Annual Inflation Rate Averages Through December 2025 Table for Selected Categories
| BLS CPI Code | BLS CPI Category Description | 1M 12/25 | 1Y 12/25 | 3Y 12/25 | 5Y 12/25 | 10Y 12/25 | 20Y 12/25 |
|---|---|---|---|---|---|---|---|
| SAF | FOOD & BEVERAGES | 0.6% | 3.0% | 2.7% | 4.8% | 3.3% | 2.9% |
| SAF11 | Food at home | 0.5% | 2.4% | 1.8% | 4.7% | 2.7% | 2.5% |
| SAF114 | Nonalcoholic beverages & beverage materials | 0.3% | 5.1% | 3.3% | 5.5% | 3.3% | 2.4% |
| SEFN | Juices & nonalcoholic drinks | 0.4% | 2.3% | 2.6% | 5.0% | 3.4% | 2.4% |
| SEFN01 | Carbonated drinks | 0.3% | 3.0% | 2.2% | 5.3% | 3.8% | 2.8% |
| SEFN03 | Nonfrozen noncarbonated juices & drinks | 0.6% | 1.3% | 2.6% | 4.7% | 3.0% | 2.0% |
| SEFP | Beverage materials including coffee & tea | 0.2% | 11.8% | 5.1% | 6.5% | 3.1% | 2.3% |
| SEFP01 | Coffee | 1.2% | 19.8% | 6.9% | 8.2% | 3.7% | 2.9% |
| SEFP02 | Other beverage materials including tea | -1.0% | 3.8% | 3.5% | 4.5% | 2.6% | 1.8% |
| SAF115 | Other food at home | 1.5% | 2.7% | 2.1% | 5.1% | 3.0% | 2.6% |
| SEFT06 | Other miscellaneous foods | 2.7% | 3.6% | 2.2% | 5.0% | 2.9% | 2.3% |
| SEFW | Alcoholic beverages at home | -0.5% | 1.0% | 1.0% | 1.9% | 1.6% | 1.5% |
| SEFW01 | Beer, ale & other malt beverages at home | -0.4% | 1.3% | 1.9% | 3.2% | 2.6% | 2.4% |
| SEFW02 | Distilled spirits at home | -0.7% | 1.8% | 0.9% | 1.5% | 1.1% | 0.9% |
| SEFW03 | Wine at home | -0.4% | 0.3% | 0.3% | 0.9% | 0.8% | 0.8% |
| SEHE | FUEL OIL & OTHER FUELS | -0.5% | 1.2% | -5.7% | 7.8% | 4.8% | 2.4% |
| SAH3 | HOUSEHOLD FURNISHINGS & OPERATIONS | -0.6% | 4.0% | 1.7% | 3.8% | 2.3% | 1.0% |
| SAA | APPAREL | -1.3% | 0.6% | 0.9% | 2.3% | 0.4% | 0.4% |
| SAM1 | MEDICAL CARE COMMODITIES | 0.3% | 1.5% | 2.2% | 2.1% | 1.7% | 2.0% |
| SEMF | Medicinal drugs | 0.5% | 1.5% | 2.3% | 2.0% | 1.7% | |
| SEMF01 | Prescription drugs | 0.1% | 2.0% | 2.1% | 1.6% | 1.7% | 8.6% |
| SEMF02 | Nonprescription drugs | 1.4% | 0.5% | 2.7% | 2.9% | 1.3% | |
| SEMG | Medical equipment and supplies | -1.2% | 1.5% | 1.5% | 3.9% | 1.2% | |
| SAR | RECREATION | 1.2% | 3.0% | 2.3% | 3.0% | 2.1% | 1.3% |
| SEEA | EDUCATIONAL BOOKS & SUPPLIES | -0.2% | 0.8% | 1.6% | 2.0% | 1.3% | 3.6% |
| SEGA | TOBACCO & SMOKING PRODUCTS | -0.2% | 6.8% | 7.1% | 7.1% | 6.0% | 6.2% |
| SEGB | PERSONAL CARE PRODUCTS | -0.3% | 1.5% | 1.8% | 2.6% | 1.0% | 0.7% |
| SEGE | MISCELLANEOUS PERSONAL GOODS | 2.4% | 2.5% | 0.1% | 3.3% | 1.0% | 0.1% |
| SAG | OTHER GOODS AND SERVICES | -0.1% | 4.2% | 4.3% | 4.8% | 3.5% | 3.1% |
| SERE | Other recreational goods | -0.5% | 1.0% | -1.7% | -0.1% | -3.2% | -3.6% |
| SERG | Recreational reading materials | -0.4% | 3.8% | 1.2% | 1.7% | 2.0% | 1.9% |
Get a Free LIFO Election Benefit Analysis
How LIFO WorksHow to Easily Implement LIFOLIFO Election Benefit Analysis Documentation Request
LIFOPro's OfferingsTurnkey Outsourcing SolutionsCPA Firm Offerings
Get a complimentary, no obligation LIFO Election Benefit Analysis & turnkey outsourcing solutions fee quote emailed to you within one week of submitting the request form below!
LIFOPro offers complimentary LIFO election scoping client lists to seamlessly integrate LIFO into year-end tax planning, maximize your firm and client’s engagement in LIFO election scoping & minimizing the time/resources required to do so. Here’s how it works:
Steps to take after obtaining your CPA firm’s LIFO election scoping client target list are as follows:

There are a variety of LIFO “submethod” alternatives available, and in some cases, there are material differences in the recurring administrative burden & long-term tax benefits amongst the various submethod options. Listed below are the most notable submethod alternatives & LIFOPro’s best practices feedback.
Using the costs of the goods paid to suppliers and vendors to measure inflation for LIFO calculation purposes is known as internal indexes. Inflation is measured by double extending current quantities against the current & prior period’s unit costs, and the sum of the current & prior period’s extensions are divided to calculate a current year inflation index. Since prior year unit costs don’t exist for new items, it’s critically important to understand the new item inflation treatment alternatives. This is especially important when new items represent a material value. A background & best practices are described below.
As an industry, auto dealers are one of the most predominant LIFO users. This is much in thanks to the consistent historical inflation that exists in the automobile industry. Most dealerships are eager to maximize tax deferral & minimize taxable income by using LIFO because of the profitable nature of the industry. There are a wide range of method alternatives & calculation options, so it’s critical to understand the various options available, and the best practices to employ, which are listed below.
The long-term LIFO tax benefits will outpace the long-term LCM reserve tax benefits because the LIFO tax benefits will grow in perpetuity when there is inflation (even if the inventory balance doesn’t increase). Contrarily, the LCM reserve tax benefits only increase when inventory levels grow and/or more vehicles are reserved or written down, and they actually decrease or are recaptured every time that a vehicle with a reserve is sold (LCM reserve is directly tied to each vehicle) . Conversely, the LIFO reserve remains intact when vehicles are sold as long as additional vehicles replace the sold vehicles by the end of the year. Said another way, the LIFO reserve is not tied directly to each vehicle, but instead based on the total dollar-value, which is why most companies use the dollar-value method, and not the specific goods or unit LIFO method which ties a LIFO value to each item.
Note: a common misconception is that companies are using specific goods or unit LIFO when they are in fact using the dollar-value LIFO method, and are using the “specific identification” or specific ID method to determine their year end inventory balance at cost i.e. Current-year Cost. Nearly all companies use dollar-value LIFO because the tax benefits are materially higher than the unit LIFO method.
The recommendations for the scope of the goods to be valued using LIFO is dependent on the inflation measurement source used by auto dealers because there are differences in the way that inflation can be measured amongst the alternatives. The best practices are broken out by the two available inflation measurement sources:
Historically speaking, the alternative LIFO method (ALM) has been the most predominantly utilized auto dealer LIFO inflation measurement source because from the time of its inception in the early 1990s up until COVID, it created materially higher inflation & long-term LIFO tax benefits than the IPIC method. With that being said, the IPIC method was occasionally used during this time because it reduced the administrative burden & tight reporting deadlines associated with the ALM (IPIC only requires inventory balances by cars, trucks and parts to calculate inflation. ALM requires invoices for all vehicles on hand at year end along with a source for obtaining the prior period base vehicle cost to measure inflation, which can be extremely burdensome).
Beginning with the COVID pandemic, the IPIC method inflation became initially comparable with the ALM. In 2021 and 2022, the IPIC method inflation became materially higher than the ALM, and because of this, sizably higher LIFO tax benefits were there for the taking by willing participants. As a result, a huge influx of accounting method changes were made by auto dealers to switch from the ALM to the IPIC method in 2021 & 2022. Additionally, many auto dealers who were making the change from the ALM to the IPIC method were also expanding their LIFO election scope to include used vehicles to take advantage of unprecedented inflation & LIFO tax benefits (and also to offset or eliminate LIFO recapture that had been or was occurring due to the material vehicle liquidations caused by the supply chain disruptions). The switch to the IPIC method was essentially a slam dunk for many auto dealers when the additional tax benefits were paired with the promise of significantly reduced administrative burden, expedited LIFO reporting and lower outsourcing costs.
As of today, there is wide-spread usage of both the alternative LIFO method and the IPIC method. As of 2025, the inflation differential & LIFO tax benefits for the upcoming year end is sometimes comparable or better for the IPIC method, but just as often can be more beneficial when using the ALM (BLS PPI inflation is 2%; ALM new vehicle inflation is wide ranging from flat to 1% – 2% inflation). With that being said, the alternative LIFO method will always carry higher administrative burdens, outsourcing costs, and longer LIFO reporting turnaround times compared to the IPIC method, so the best practices regarding the inflation measurement source will be dependent on the specific wants and needs of each dealer. An overview of the two alternatives are provided below.
Alternative LIFO method (ALM): Measures inflation based on comparing current & prior period’s invoice costs for all vehicles on hand at year end; Item definition are the model codes.
IPIC method: Measures inflation by using Bureau of Labor Statistics Consumer/Producer Price Index (BLS CPI/PPI); Items are defined by the BLS categories (1. Cars 2. Trucks, SUVs & minivans 3. Parts)


When an error or series of errors occur in the LIFO calculation, the corrective actions available and/or required to be made are dependent on the frequency of the error (if the error occurred once or in multiple consecutive periods). Separate GAAP or financial reporting and tax rules also apply when accounting for LIFO errors, which are outlined below.
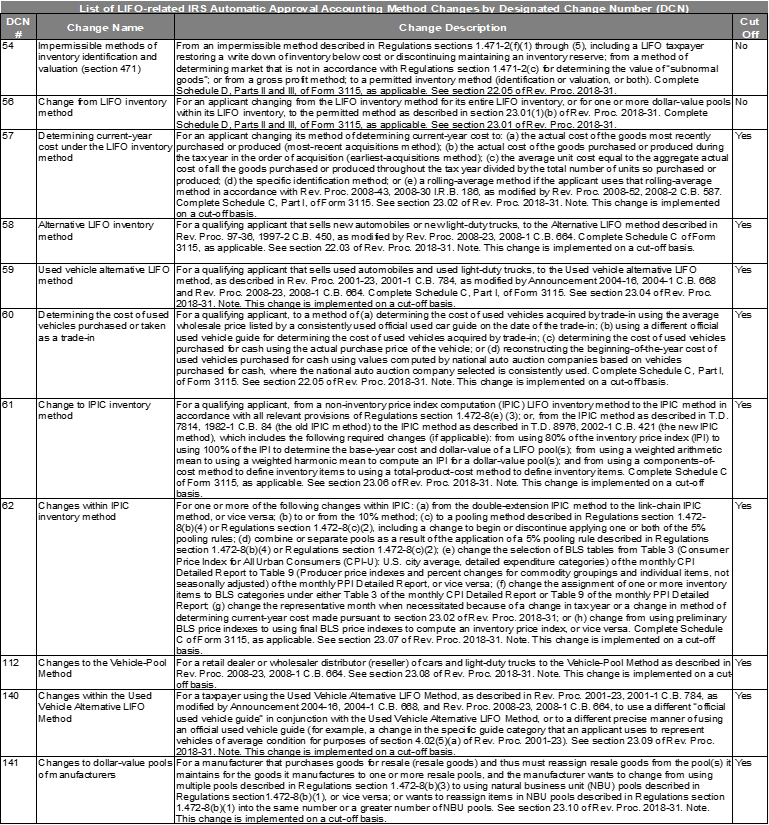
Most LIFO-related IRS accounting method changes are applied on a cut-off basis, which implies the change is applied prospectively beginning in the year of change, and no §481(A) adjustment to adjust income as reported under the new method is required or permitted. The two exceptions are designated change number (DCN) 54 for Impermissible methods of inventory identification & valuation & DCN 56 for changing from the LIFO method to a non-LIFO method (aka terminating LIFO election). Both of the aforementioned changes are not applied prospectively & require prior period adjustments because they relate to non-LIFO inventory regulations which fall under §471 (all LIFO regulations fall under §472). A complete list of LIFO-related automatic approval accounting method changes are provided below.
Get top-notch complimentary analysis & review from the LIFO experts. LIFOPro offers Best LIFO Practices & Methods Reviews for companies on LIFO. We also provide LIFO Election Benefit Analysis for companies considering adopting LIFO. Companies seeking an automated LIFO solution or replacement to their current LIFO system can get a free software trial.


LIFOPro makes being on LIFO as simple as possible. We act as a third party LIFO service provider & subject matter expert to both CPA firms & companies. We design customized solutions that fit your firm & client’s LIFO needs, not a one-size fits all solution that offers more or less than what is needed. Our powerful in-house developed/maintained software allows us to automate most aspects of the work, spend a fraction of the time required by anyone else making manual LIFO calculations & deliver high-quality solutions at the most reasonable costs. We work with companies of all sizes and situations, including companies already on LIFO or those that aren’t but are considering a LIFO election.


Guides
Complimentary Offerings
LIFOPro’s Offerings
Sample Reports
LIFO Library
Schedule a call with the LIFOPro team today to lean how your firm, client or company can partner with us for all your LIFO needs & to make being on LIFO as simple as possible!
Sign up today to receive industry news & promotional offers from LIFO-PRO