LIFOPro’s 2021 LIFO Lookout
- LIFO continues to be the biggest inventory-related tax savings tool
- Unprecedented inflation has occurred this year, creating widespread once in a lifetime tax saving opportunities from electing LIFO in 2021
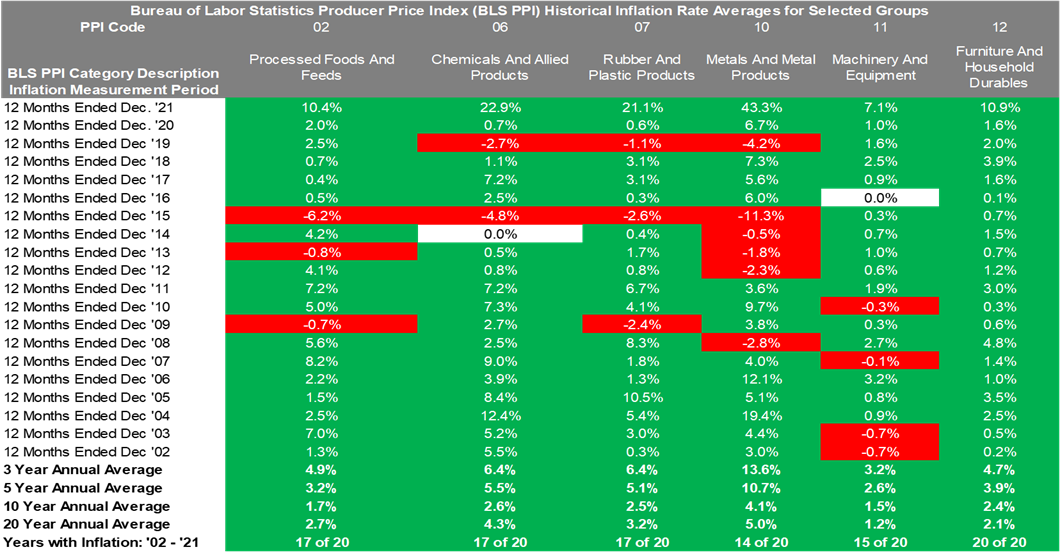
- Top LIFO candidates & 12 months ended Dec. ‘21 inflation are as follows (includes all manufacturers, wholesalers & retailers):
- Processed foods & feeds – 10%
- Chemicals and allied products – 23%
- Plastics & rubber products – 21%
- Metal & metal products – 43%
- Machinery & equipment, including farm/ag & construction machinery – 7%
- Furniture & household goods – 11%
- Auto dealers – 12% new vehicles & 37% used vehicles
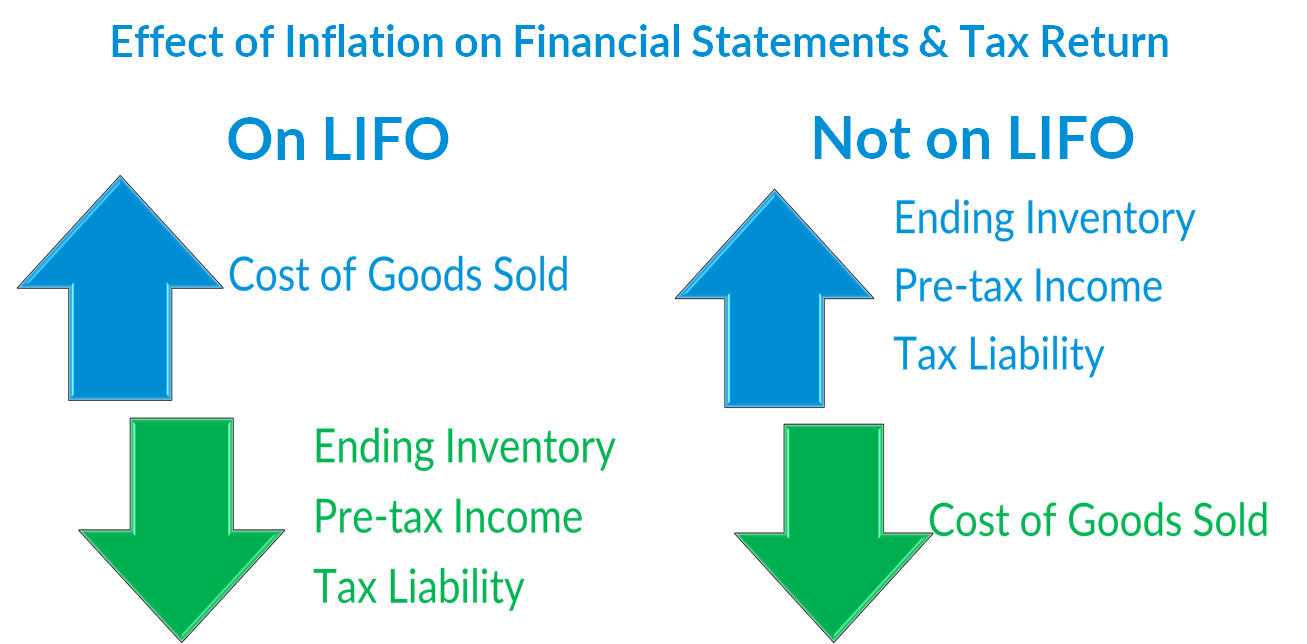
- Current year (CY) tax savings from LIFO formula
-
- Calculate CY LIFO expense (∆ in LIFO reserve) = Prior year ending inventory balance @ cost (FIFO/average cost) * Current year inflation rate
- Calculate CY tax savings from LIFO = Current year LIFO expense * Current year tax rate
- Current year after-tax cash savings from LIFO example
- Inputs
- Prior year end inventory balance at cost: $10M
- Current year inflation rate: 10%
- Combined state & local tax rate: 40%
- Outputs
- CY LIFO expense: $10M * 10% = $1M
- CY tax cash savings from LIFO: $1M * 40% = $400K
- Inputs
-
- LIFO’s here to stay
- Threat of LIFO repeal is minimal according to LIFO lobbying group
- All spending bills currently working through Congress exclude LIFO repeal
- Potential for higher tax rates on the horizon will create higher tax savings from LIFO
- IRS Concept Unit
- IRS released 21 page slide deck outlining road map for auditing LIFO calculations: LIFO Records (irs.gov)
- Concept Unit stresses LIFO books & records adequacy & emphasizes the need to maintain detailed documentation for each year’s calculation since the first year on LIFO
- Also emphasizes the fact that the service may terminate a taxpayers LIFO election & force them to take 100% of LIFO reserve into income if LIFO books & records are deemed inadequate
- See LIFOPro’s blog for more details on this development: IRS Releases Roadmap for Auditors to use on LIFO Taxpayers
Bureau of Labor Statistics Producer Price Index Inflation for Selected Major Commodity Groups

Quick LIFO 101 Refresher

- Creates material long-term tax savings because benefits grow annually when there’s inflation
- Minimal administrative burden under dollar value LIFO – No changes are required to accounting system & items continue to be tracked using same cost flow method historically used prior to going on LIFO. Learn more here: How Dollar Value LIFO Minimizes Administrative Burden & Provides More Tax Savings than Unit LIFO
- Under dollar-value LIFO method, tax savings are preserved even when goods responsible for building that reserve are discontinued or sold as long as the dollar value of those goods are replaced with other goods (unlike specific goods or “unit” LIFO or a lower of cost or market reserve)
What are the biggest misconceptions about LIFO?
- Companies with high turnover can’t benefit from LIFO – Under link-chain dollar-value LIFO, the tax savings from LIFO will be the same regardless of if the turnover rate is high or low (assuming the same ending inventory balance). This is because a 12- month period is used to calculate inflation on inventories on hand at the end of the year regardless of how many times the inventory turns during the reporting period.
- Item costs & the physical flow of goods must be tracked on a LIFO basis – Under link-chain dollar-value LIFO, item costs remain being tracked the same way they were prior to electing LIFO, meaning no acctg. system changes are required.
- Cost accounting & management purchasing/sales functions will be complicated by using LIFO – Under the link-chain dollar-value method, item costs are not tracked on a LIFO basis & buying/selling decisions remain unaffected.
- Internal costs must be used to measure LIFO inflation – GAAP and IRS Regs. allow for government-published external inflation indexes to be used to measure LIFO inflation using Bureau of Labor Statistics Consumer/Producer Price Indexes.
- Administrative burdens/costs outweigh the benefits/savings
- LIFOPro’s Turnkey outsourcing solutions makes being on LIFO as painless as possible, while doing so at reasonable costs
- Enjoy the tax savings & improved cash flow from LIFO without having to develop expertise in-house
- Maximize calculation accuracy & minimize financial reporting/IRS audit risk
- Eliminate big surprises at year end by having service provider performing interim estimates
- Clients provided LIFOPro PDF report package containing comprehensive calculation documentation, including all amounts required to record journal entry & complete IRS form inventory line items
How Can Companies Easily Implement LIFO?
- LIFOPro makes being on LIFO as pain-free as possible
- With our turnkey outsourcing solutions, all aspects of a company’s LIFO calculation can be outsourced to LIFOPro, including:
- Requesting the raw data required to complete the LIFO calculation & organizing the documentation provided by the client
- Completing the inflation index, LIFO layer & LIFO reserve calculation, which represent the front & back ends of all dollar-value LIFO calculations
- Maintaining the LIFO permanent files within our LIFOPro software & delivering a LIFOPro PDF report package that includes comprehensive calculation documentation & all amounts required for financial reporting & tax return purposes
- Performing interim LIFO estimates & ad-hoc projections
- Integrating §263A UNICAP costs into our LIFOPro reports
- Completing LIFO-related accounting method changes, including layer history rebasing, pool combinations & splits
- IRS forms 970 & 3115 preparation for LIFO elections & LIFO-related method changes
- The LIFOPro software can also be licensed by companies & CPA firms
- Companies & CPA firms can rest assured knowing that LIFOPro will offer comprehensive & affordable solutions for all their LIFO needs
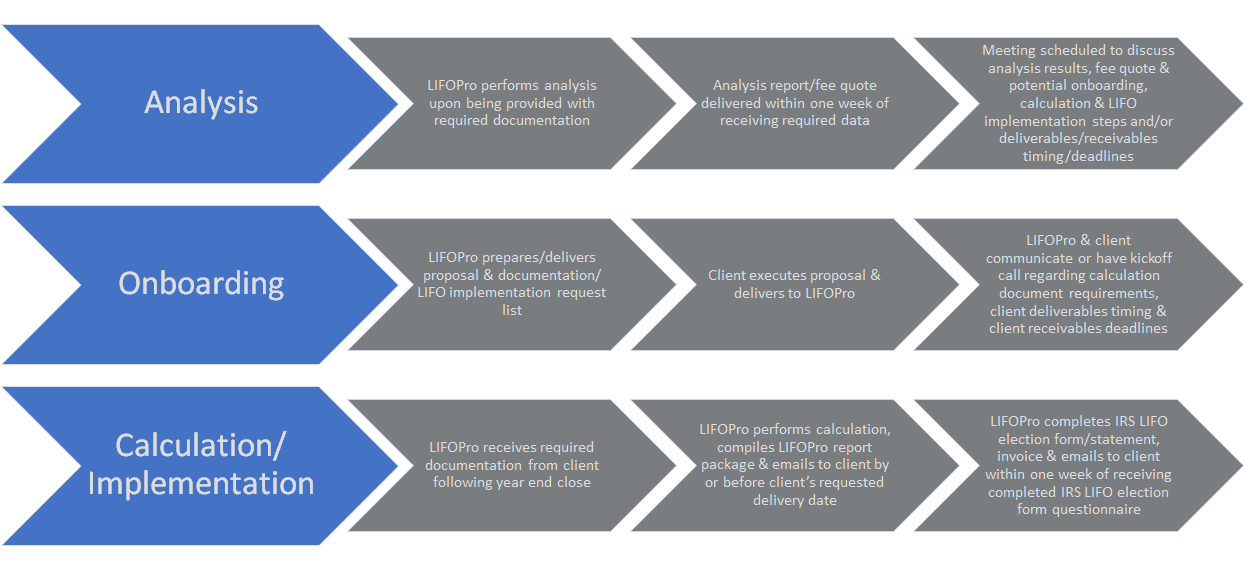
LIFOPro’s Turnkey Outsourcing Solutions Process Flow: Election Year

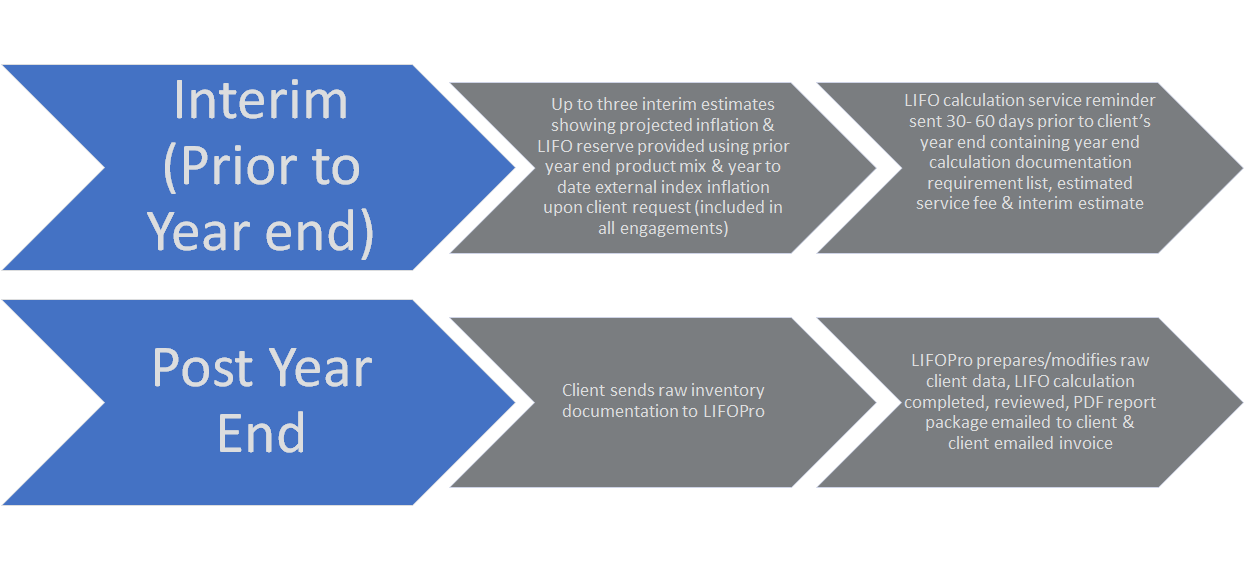
LIFOPro’s Turnkey Outsourcing Solutions Process Flow: Recurring (Optional)

2021 Top LIFO Candidates by Product/Item
| PPI Code | BLS PPI Category Description | 12M Dec. '21 | 3Y Annual Avg. Dec. '21 | 5Y Annual Avg. Dec. '21 | 10Y Annual Avg. Dec. '21 | 20Y Annual Avg. Dec. '21 |
|---|---|---|---|---|---|---|
| 01 | FARM PRODUCTS | 23.9% | 8.0% | 6.8% | 1.5% | 3.5% |
| 011 | Fruits & melons, fresh/dry vegs. & nuts | 9.4% | -5.5% | 5.6% | 3.4% | 3.6% |
| 012 | Grains | 43.9% | 18.5% | 13.8% | 0.8% | 5.7% |
| 013 | Slaughter livestock | 23.0% | 6.6% | 4.2% | 0.7% | 2.9% |
| 014 | Slaughter poultry | 52.4% | 14.7% | 8.4% | 4.7% | 4.4% |
| 015 | Raw cotton | 48.6% | 12.3% | 8.3% | 0.9% | 5.7% |
| 016 | Raw milk | -3.5% | 8.4% | 2.0% | -0.1% | 0.8% |
| 017 | Chicken eggs | 95.5% | 6.1% | 9.2% | 1.4% | 5.2% |
| 018 | Hay, hayseeds and oilseeds | 11.5% | 11.9% | 6.1% | 1.1% | 4.6% |
| 02 | PROCESSED FOODS AND FEEDS | 10.4% | 4.9% | 3.2% | 1.7% | 2.7% |
| 021 | Cereal and bakery products | 9.2% | 3.2% | 2.7% | 1.5% | 2.8% |
| 022 | Meats, poultry, and fish | 20.0% | 9.2% | 4.8% | 2.7% | 3.0% |
| 023 | Dairy products | 7.6% | 4.0% | 1.9% | 1.0% | 1.7% |
| 024 | Processed fruits and vegetables | 4.5% | 2.4% | 2.4% | 1.7% | 2.8% |
| 025 | Sugar and confectionery | 3.1% | 1.7% | 1.2% | 0.5% | 2.7% |
| 026 | Beverages and beverage materials | 3.3% | 2.3% | 1.9% | 1.4% | 2.1% |
| 027 | Fats and oils | 42.5% | 14.7% | 8.3% | 1.9% | 6.1% |
| 028 | Miscellaneous processed foods | 5.9% | 2.0% | 2.4% | 1.6% | 2.2% |
| 029 | Prepared animal feeds | 8.0% | 5.9% | 3.9% | 1.4% | 3.8% |
| 03 | TEXTILE PRODUCTS AND APPAREL | 15.4% | 4.7% | 3.8% | 1.9% | 1.8% |
| 031 | Synthetic fibers | 22.0% | 5.4% | 5.5% | 2.5% | 1.8% |
| 032 | Processed yarns and threads | 29.3% | 6.7% | 5.8% | 1.8% | 2.7% |
| 033 | Greige fabrics | 13.3% | 3.2% | 2.6% | 0.3% | 1.6% |
| 034 | Finished fabrics | 14.5% | 5.7% | 4.1% | 2.3% | 2.2% |
| 038 | Apparel & other fabricated textile prods | 7.0% | 2.7% | 2.2% | 1.8% | 1.4% |
| 039 | Miscellaneous textile products/services | 25.7% | 5.2% | 3.7% | 1.7% | 1.8% |
| 04 | HIDES, SKINS, LEATHER, AND RELATED PRODUCTS | 0.9% | 0.3% | -2.5% | -1.3% | 0.5% |
| 041 | Hides and skins, incl. cattle | -15.6% | -6.5% | -11.0% | -7.5% | -1.9% |
| 042 | Leather | 13.2% | 2.6% | -3.0% | -2.3% | 0.1% |
| 043 | Footwear | 6.0% | 3.0% | 2.3% | 2.7% | 2.1% |
| 044 | Other leather and related products | 3.0% | 1.8% | 1.7% | 2.1% | 1.6% |
| 05 | FUELS AND RELATED PRODUCTS AND POWER | 38.3% | 6.7% | 6.9% | 0.2% | 3.9% |
| 051 | Coal | 0.4% | -1.9% | -0.3% | -0.9% | 3.4% |
| 053 | Gas fuels | 108.2% | 1.3% | 7.8% | 0.5% | 4.0% |
| 055 | Utility natural gas | 40.5% | 9.0% | 9.3% | 4.5% | 4.0% |
| 056 | Crude petroleum (domestic production) | 48.6% | 9.2% | 6.0% | -3.9% | 4.8% |
| 057 | Petroleum products, refined | 57.4% | 11.8% | 10.8% | -1.0% | 5.1% |
| 058 | Asphalt and other petroleum and coal products, n.e.c. | 48.7% | 8.7% | 15.2% | -1.9% | 8.7% |
| 06 | CHEMICALS AND ALLIED PRODUCTS | 22.9% | 6.4% | 5.5% | 2.6% | 4.3% |
| 061 | Industrial chemicals | 44.5% | 9.3% | 7.3% | 0.9% | 5.1% |
| 062 | Paints and allied products | 13.9% | 6.0% | 5.1% | 2.7% | 3.8% |
| 063 | Drugs and pharmaceuticals | 2.9% | 2.4% | 3.2% | 4.6% | 4.5% |
| 064 | Fats and oils, inedible | 49.7% | 21.3% | 8.3% | 0.5% | 6.6% |
| 065 | Agricultural chemicals and chemical products | 49.5% | 12.5% | 10.2% | 2.4% | 4.9% |
| 066 | Plastic resins and materials | 36.3% | 8.6% | 7.7% | 3.2% | 4.5% |
| 067 | Other chemicals and allied products | 8.7% | 3.3% | 2.8% | 1.9% | 2.4% |
| 07 | RUBBER AND PLASTIC PRODUCTS | 21.1% | 6.4% | 5.1% | 2.5% | 3.2% |
| 071 | Rubber and rubber products | 11.0% | 3.5% | 2.8% | 0.6% | 2.7% |
| 072 | Plastic products | 24.1% | 7.2% | 5.7% | 3.1% | 3.3% |
| 08 | LUMBER AND WOOD PRODUCTS | 16.4% | 10.2% | 7.3% | 5.0% | 3.0% |
| 081 | Lumber | 19.6% | 17.6% | 10.9% | 7.7% | 3.5% |
| 082 | Millwork | 17.7% | 8.6% | 6.8% | 4.8% | 3.2% |
| 083 | Plywood | 14.2% | 10.7% | 9.1% | 5.4% | 3.0% |
| 084 | Other wood products | 17.1% | 7.2% | 6.0% | 3.9% | 2.5% |
| 085 | Logs, bolts, timber, pulpwood, woodchips and other roundwood products | 7.8% | 2.1% | 1.9% | 1.2% | 1.9% |
| 086 | Prefabricated wood buildings & components | 25.6% | 10.6% | 8.0% | 5.3% | 3.6% |
| 087 | Treated wood and contract wood preserving | 6.1% | 7.1% | 4.8% | 4.3% | 2.5% |
| 09 | PULP,PAPER, AND ALLIED PRODUCTS | 16.0% | 5.3% | 4.1% | 2.3% | 2.6% |
| 091 | Pulp, paper, and prod., ex. bldg. paper | 18.6% | 4.9% | 4.2% | 2.3% | 2.8% |
| 092 | Building paper & building board mill prods. | 13.6% | 22.5% | 12.5% | 8.5% | 5.4% |
| 094 | Publications, printed matter & printing material | 9.5% | 4.5% | 3.2% | 1.7% | |
| 10 | METALS AND METAL PRODUCTS | 43.3% | 13.6% | 10.7% | 4.1% | 5.0% |
| 101 | Iron and steel | 90.6% | 20.9% | 17.1% | 5.5% | 7.1% |
| 102 | Nonferrous metals | 19.2% | 11.1% | 8.5% | 2.6% | 5.2% |
| 103 | Metal containers | 21.6% | 6.9% | 6.4% | 2.7% | 3.2% |
| 104 | Hardware | 17.5% | 6.6% | 5.0% | 2.9% | 2.8% |
| 105 | Plumbing fixtures and fittings | 5.4% | 3.5% | 3.4% | 2.5% | 2.7% |
| 106 | Heating equipment | 21.3% | 8.3% | 6.4% | 4.1% | 4.0% |
| 107 | Fabricated structural metal products | 41.6% | 13.0% | 9.7% | 4.9% | 4.4% |
| 108 | Miscellaneous metal products | 14.0% | 5.1% | 4.3% | 2.1% | 2.4% |
| 11 | MACHINERY AND EQUIPMENT | 7.1% | 3.2% | 2.6% | 1.5% | 1.2% |
| 111 | Agricultural machinery and equipment | 14.6% | 5.8% | 4.3% | 2.8% | 3.0% |
| 112 | Construction machinery and equipment | 10.1% | 4.4% | 3.5% | 2.6% | 2.8% |
| 113 | Metalworking machinery and equipment | 7.3% | 3.1% | 2.7% | 1.9% | 1.8% |
| 114 | General purpose machinery and equipment | 10.1% | 4.6% | 4.0% | 2.8% | 3.0% |
| 115 | Electronic computers and computer equipment | 4.3% | -0.9% | -1.0% | -2.4% | -5.1% |
| 116 | Special industry machinery and equipment | 11.6% | 5.1% | 3.7% | 2.3% | 1.9% |
| 117 | Electrical machinery and equipment | 5.2% | 2.3% | 1.9% | 0.9% | 0.3% |
| 118 | Miscellaneous instruments | 3.5% | 2.3% | 2.1% | 1.8% | 1.8% |
| 119 | Miscellaneous machinery | 4.1% | 2.1% | 1.8% | 1.1% | 1.8% |
| 12 | FURNITURE AND HOUSEHOLD DURABLES | 10.9% | 4.7% | 3.9% | 2.4% | 2.1% |
| 121 | Household furniture | 13.3% | 5.4% | 4.3% | 2.7% | 2.5% |
| 122 | Commercial furniture | 12.5% | 5.5% | 4.8% | 2.9% | 2.7% |
| 123 | Floor coverings | 7.4% | 2.5% | 2.8% | 1.7% | 2.6% |
| 124 | Household appliances | 8.3% | 4.4% | 3.7% | 1.9% | 1.3% |
| 125 | Home electronic equipment | 8.8% | 3.9% | 2.3% | 1.0% | -1.0% |
| 126 | Other household durable goods | 9.8% | 4.5% | 3.2% | 2.1% | 1.8% |
| 13 | NONMETALIC MINERAL PRODUCTS | 7.8% | 3.8% | 3.5% | 3.0% | 3.3% |
| 131 | Glass | 6.5% | 3.7% | 3.0% | 2.8% | 1.5% |
| 132 | Concrete ingredients and related products | 4.1% | 3.7% | 3.7% | 3.6% | 3.8% |
| 133 | Concrete products | 8.4% | 4.6% | 4.0% | 3.6% | 3.5% |
| 134 | Clay construction products ex. refractories | 5.4% | 2.9% | 1.9% | 1.5% | 1.3% |
| 135 | Refractories | 7.2% | 4.3% | 3.8% | 2.7% | 3.5% |
| 136 | Asphalt felts and coatings | 11.7% | 4.2% | 5.1% | 1.9% | 4.8% |
| 137 | Gypsum products | 20.2% | 6.1% | 6.0% | 6.9% | 4.9% |
| 138 | Glass containers | 6.8% | 3.7% | 2.8% | 2.1% | 2.7% |
| 139 | Other nonmetallic minerals | 8.4% | 2.6% | 2.5% | 1.9% | 3.3% |
| 14 | TRANSPORTATION EQUIPMENT | 3.9% | 1.7% | 1.5% | 1.3% | 1.4% |
| 141 | Motor vehicles and equipment | 4.6% | 1.7% | 1.4% | 1.3% | 1.1% |
| 142 | Aircraft and aircraft equipment | 1.6% | 1.4% | 1.3% | 1.4% | 2.2% |
| 143 | Ships and boats | 5.2% | 3.2% | 2.4% | 1.8% | 2.6% |
| 144 | Railroad equipment | 5.1% | 2.2% | 1.3% | 1.2% | 2.3% |
| 149 | Transportation equipment, n.e.c. | 10.2% | 3.7% | 3.3% | 2.0% | 1.7% |
| 15 | MISCELLANEOUS PRODUCTS | 6.3% | 4.3% | 3.6% | 2.7% | 2.5% |
| 151 | Toys, sporting goods, small arms, etc. | 9.7% | 4.8% | 2.9% | 2.0% | 1.6% |
| 152 | Tobacco products, incl. stemmed & redried | 7.7% | 6.8% | 6.3% | 5.5% | 4.4% |
| 153 | Notions | 12.6% | 4.8% | 3.6% | 2.2% | 3.1% |
| 154 | Photographic equipment and supplies | 7.2% | 4.7% | 3.4% | 2.0% | 1.5% |
| 155 | Mobile homes | 30.1% | 15.4% | 11.0% | 6.8% | 5.3% |
| 156 | Medical, surgical & personal aid devices | 1.3% | 1.3% | 1.2% | 1.0% | 1.2% |
| 157 | Other industrial safety equipment | 7.0% | 3.0% | 2.0% | 2.1% | 1.8% |
| 159 | Other miscellaneous products | 8.7% | 5.4% | 4.0% | 2.2% | 2.2% |
Get a Complimentary LIFO Election Benefit Analysis Today!
How it Works & What’s Included
- How it Works:
- Step 1: Send documentation required to perform analysis: see below or download our LIFO Election Benefit Analysis Documentation Request List
- Step 2: LIFOPro performs benefit analysis
- Step 3: LIFOPro delivers benefit analysis report & turnkey outsourcing solutions fee quote within one week of receipt of required documentation
- What’s included:
- LIFO Election Benefit Analysis Report
- Projected after-tax cash savings that would occur if LIFO were elected this year
- Pro forma calculation results showing the after-tax cash savings that would have accrued if LIFO were to have been elected 20 years ago
- Historical inflation trends
- LIFOPro’s recommendations regarding the following:
- If LIFO should or shouldn’t be elected
- The most optimal & compliant submethods to use
- How LIFO works Appendix detailing the mechanics of LIFO, steps for first-time LIFO users & detailed examples of how to record GL journal entries to adjust inventories from cost to LIFO
- Turnkey outsourcing solutions and software license quotes
- LIFO Election Benefit Analysis Report
LIFO Election Benefit Analysis Documentation Requirements
-
- Current period & prior year end item detail reports: also known as stock status or inventory valuation report. Should contain the following applicable fields:
- Item/part number or code (or SKU/UPC)
- Item/part description or name
- Stage of production (if applicable)
- Unit of measure (if applicable)
- Current period quantity on hand
- Current period item/unit cost
- Product hierarchies
- Include product hierarchies in the item detail reports, or provide a separate listing of the product hierarchies that allows for these classes to be mapped to the item detail report.
- Examples of product hierarchies include:
- Classes/subclasses
- Categories/subcategories
- Product groups/lines
- Item/product types
- Department/subdepartment
- Business segment/unit or cost/profit center
- This data can substantially reduce the time required to assign inflation categories to items, increase the accuracy of the inflation categories assigned to any given item, can substantially reduce any proposed costs to outsource the LIFO calculation & increase the accuracy of the projected tax savings.
- Current period & prior year end item detail reports: also known as stock status or inventory valuation report. Should contain the following applicable fields:
Get a LIFO Election Benefit AnalysisSample LIFO Election Benefit Analysis ReportLIFO Election Benefit Analysis Documentation Request
LIFOPro's 2021 LIFO Lookout & Top Candidate GuideLIFOPro's 2021 Top LIFO Candidate List
