CPA Firm LIFO Opportunities Training Guide
CPA firms are considered to be financial reporting and tax compliance gatekeepers to the clients they serve. Furthermore, they possess the potential to be the biggest advocates of LIFO to their clientele because accountants at most companies know little or nothing about LIFO. CPA firms exercising due diligence should consider LIFO analysis to be mandatory rather than an optional exercise as the lowered tax payments and improved cash flows from LIFO can play a key role in the growth and improved cash flow of their clients. Ideally, CPA firms should perform a preliminary LIFO analysis for all clients that have inventory.
Although the new IPIC method LIFO Regulations issued in 2002 simplified LIFO computations for many taxpayers, the LIFO Regs. are not simpler to understand. This is because: 1) the number of new rules and calculation methods increased in the new Regs. and 2) the Regs. are written by Washington IRS Accounting Methods lawyers for whom plain speaking seems to be a foreign language. Aside from confusing IRS LIFO rules, one of the reasons LIFO errors are so common (we seldom review error free LIFO calculations) is that no one ever does enough LIFO calculations and IRS filings often enough to develop expertise in this area sufficient to ensure full advantage is taken of the tax saving benefits of LIFO and to provide assurance that the calculations are correct. Even the “LIFO experts” at the large CPA firms have limited hands-on experience because they concentrate mostly on accounting methods and compliance.
LIFO-PRO uses the following criteria to determine if a company is a good candidate to use LIFO:
Timing is key when making a LIFO election because it will affect the amount of current & future period’s tax savings achieved. The point of emphasis is to understand the working parts that goes into determining the potential LIFO benefits. Although meeting the three criteria listed above would likely indicate that a company is a good LIFO candidate at some point in time, both the three criteria above along with the following criteria below should be met to make a LIFO election in the current period:
Based on the above-listed criteria for choosing the right time to elect LIFO, it would be unwise to make a LIFO election in the current period if any of the following are true:
To recap, the following criteria should be met to make a LIFO election for your company’s upcoming year end:
For companies with inflationary inventories, LIFO acts like an annuity that provides annual returns, and the long-term benefits can be substantial. Choosing the right time to start using LIFO will allow your client or prospective client to maximize the tax benefits that it provides.
We recommend using the following one or both of the following to determine the potential benefits of LIFO for your client or prospective client
Use the following formulas to calculate the estimated LIFO tax savings that a company could achieve from using the LIFO method:
Example: To illustrate the use of the Quick Analysis LIFO Tax Savings Formula, assume the following:
Estimated year end inventory balance: $15,000,000
Estimated current year inflation: 2%
Tax rate: 30%
Current year taxable income reduction: $15,000,000 * 2% = $300,000
Current year income tax reduction: $300,000 * 30% = $90,000A long-term LIFO benefit analysis could be achieved by using the same formula shown above and multiplying the results by the desired number of years that you’re wishing to project (i.e. 3/5/10/20 year).
| BLS PPI Code | BLS PPI Commodity Description | 9M Ended Sep. '22 (YTD) | 12M Ended Sep. '22 | 12M Ended Dec. '21 | 12M Ended Dec. '20 | 3 Year Annual Avg. | 5 Year Annual Avg. | 10 Year Annual Avg. | 20 Year Annual Avg. | Inflation Freq-uency | Infl-ation Freq. Rate | YTD vs. 20Y Average Multiplier |
|---|---|---|---|---|---|---|---|---|---|---|---|---|
| 02 | Processed foods & feeds | 10.2% | 9.7% | 10.4% | 2.0% | 4.9% | 3.2% | 1.7% | 2.8% | 17 of 20 | 85% | 3.6 |
| 021 | Cereal & bakery products | 12.9% | 15.6% | 9.2% | 0.1% | 3.2% | 2.7% | 1.5% | 2.8% | 16 of 20 | 80% | 4.6 |
| 022 | Meats, poultry & fish | 3.8% | -2.3% | 20.0% | 2.7% | 9.2% | 4.8% | 2.7% | 3.3% | 14 of 20 | 70% | 1.2 |
| 023 | Dairy products | 13.2% | 18.0% | 7.6% | -3.0% | 4.0% | 1.9% | 1.0% | 2.2% | 11 of 20 | 55% | 6.0 |
| 024 | Processed fruits & vegetables | 14.3% | 16.3% | 4.5% | 3.8% | 2.4% | 2.4% | 1.7% | 2.7% | 17 of 20 | 85% | 5.2 |
| 025 | Sugar & confectionery | 8.6% | 9.4% | 3.1% | -1.4% | 1.7% | 1.2% | 0.5% | 2.6% | 16 of 20 | 80% | 3.3 |
| 026 | Beverages & beverage materials | 8.6% | 10.4% | 3.3% | 2.1% | 2.3% | 1.9% | 1.4% | 2.1% | 20 of 20 | 100% | 4.1 |
| 027 | Fats & oils | 10.5% | 11.8% | 42.5% | 10.8% | 14.7% | 8.3% | 1.9% | 6.3% | 11 of 20 | 55% | 1.7 |
| 028 | Miscellaneous processed foods | 14.6% | 16.9% | 5.9% | 1.2% | 2.0% | 2.4% | 1.6% | 2.2% | 16 of 20 | 80% | 6.7 |
| 029 | Prepared animal feeds | 17.1% | 15.9% | 8.0% | 9.6% | 5.9% | 3.9% | 1.4% | 3.9% | 15 of 20 | 75% | 4.4 |
| 03 | Textile products & apparel | 8.7% | 12.9% | 15.4% | -0.2% | 4.7% | 3.8% | 1.9% | 1.8% | 13 of 20 | 65% | 4.8 |
| 032 | Processed yarns & threads | 17.9% | 27.1% | 29.3% | -2.0% | 6.7% | 5.8% | 1.8% | 2.7% | 13 of 20 | 65% | 6.5 |
| 033 | Greige fabrics | 11.7% | 15.3% | 13.3% | -1.1% | 3.2% | 2.6% | 0.3% | 1.6% | 11 of 20 | 55% | 7.1 |
| 034 | Finished fabrics | 9.1% | 12.1% | 14.5% | 1.8% | 5.7% | 4.1% | 2.3% | 2.2% | 14 of 20 | 70% | 4.1 |
| 038 | Apparel & other fabricated textile prods | 4.2% | 7.3% | 7.0% | -0.1% | 2.7% | 2.2% | 1.8% | 1.4% | 16 of 20 | 80% | 3.1 |
| 039 | Miscellaneous textile products/services | 26.1% | 37.5% | 25.7% | 2.2% | 5.2% | 3.7% | 1.7% | 1.8% | 12 of 20 | 60% | 14.5 |
| 043 | Footwear | 6.6% | 10.0% | 6.0% | -0.2% | 3.0% | 2.3% | 2.7% | 2.1% | 18 of 20 | 90% | 3.1 |
| 044 | Other leather & related products | 4.0% | 5.0% | 3.0% | 1.1% | 1.8% | 1.7% | 2.1% | 1.6% | 19 of 20 | 95% | 2.5 |
| 05 | Fuels & related products & power | 33.8% | 36.6% | 38.3% | -6.3% | 6.7% | 6.9% | 0.2% | 4.9% | 13 of 20 | 65% | 6.8 |
| 053 | Gas fuels | 72.8% | 93.5% | 108.2% | 9.1% | 1.3% | 7.8% | 0.5% | 4.6% | 11 of 20 | 55% | 15.8 |
| 055 | Utility natural gas | 8.7% | 33.7% | 40.5% | 14.5% | 9.0% | 9.3% | 4.5% | 4.4% | 13 of 20 | 65% | 2.0 |
| 056 | Crude petroleum (domestic production) | 33.0% | 31.1% | 48.6% | -22.3% | 9.2% | 6.0% | -3.9% | 7.7% | 13 of 20 | 65% | 4.3 |
| 057 | Petroleum products, refined | 39.5% | 40.6% | 57.4% | -15.3% | 11.8% | 10.8% | -1.0% | 7.7% | 13 of 20 | 65% | 5.1 |
| 058 | Asphalt & other petroleum & coal products | 19.4% | 44.1% | 48.7% | 11.9% | 8.7% | 15.2% | -1.9% | 9.0% | 12 of 20 | 60% | 2.2 |
| 06 | Chemicals & allied products | 5.5% | 6.4% | 22.9% | 0.7% | 6.4% | 5.5% | 2.6% | 4.5% | 17 of 20 | 85% | 1.2 |
| 061 | Industrial chemicals | 5.7% | 4.1% | 44.5% | -3.1% | 9.3% | 7.3% | 0.9% | 5.3% | 12 of 20 | 60% | 1.1 |
| 062 | Paints & allied products | 17.9% | 21.4% | 13.9% | 1.4% | 6.0% | 5.1% | 2.7% | 3.9% | 17 of 20 | 85% | 4.6 |
| 064 | Fats & oils, inedible | 16.0% | 8.0% | 49.7% | 15.2% | 21.3% | 8.3% | 0.5% | 7.4% | 12 of 20 | 60% | 2.2 |
| 065 | Agricultural chemicals & chemical products | 14.6% | 30.8% | 49.5% | 3.8% | 12.5% | 10.2% | 2.4% | 5.1% | 13 of 20 | 65% | 2.9 |
| 067 | Other chemicals & allied products | 9.7% | 13.4% | 8.7% | 0.3% | 3.3% | 2.8% | 1.9% | 2.4% | 19 of 20 | 95% | 4.0 |
| 07 | Rubber & plastic products | 9.2% | 14.3% | 21.1% | 0.6% | 6.4% | 5.1% | 2.5% | 3.2% | 17 of 20 | 85% | 2.9 |
| 071 | Rubber & rubber products | 11.3% | 12.7% | 11.0% | 0.3% | 3.5% | 2.8% | 0.6% | 2.7% | 14 of 20 | 70% | 4.2 |
| 072 | Plastic products | 8.6% | 14.8% | 24.1% | 0.7% | 7.2% | 5.7% | 3.1% | 3.3% | 16 of 20 | 80% | 2.6 |
| 082 | Millwork | 10.9% | 14.9% | 17.7% | 7.9% | 8.6% | 6.8% | 4.8% | 3.2% | 19 of 20 | 95% | 3.4 |
| 084 | Other wood products | 9.9% | 7.7% | 17.1% | 2.9% | 7.2% | 6.0% | 3.9% | 2.5% | 15 of 20 | 75% | 3.9 |
| 085 | Logs, bolts, timber, pulpwood & wood chips | 4.8% | 3.0% | 7.8% | 3.2% | 2.1% | 1.9% | 1.2% | 2.0% | 15 of 20 | 75% | 2.4 |
| 086 | Prefabricated wood buildings & components | 8.5% | 13.8% | 25.6% | 6.2% | 10.6% | 8.0% | 5.3% | 3.7% | 17 of 20 | 85% | 2.3 |
| 087 | Treated wood & contract wood preserving | 10.5% | 22.1% | 6.1% | 12.4% | 7.1% | 4.8% | 4.3% | 2.7% | 14 of 20 | 70% | 3.9 |
| 09 | Pulp, paper & allied products | 9.4% | 12.8% | 16.0% | 3.0% | 5.3% | 4.1% | 2.3% | 2.6% | 16 of 20 | 80% | 3.6 |
| 091 | Pulp, paper & prod., ex. bldg. paper | 9.2% | 12.5% | 18.6% | 1.6% | 4.9% | 4.2% | 2.3% | 2.8% | 15 of 20 | 75% | 3.3 |
| 094 | Publications, printed matter & printing material | 12.6% | 17.4% | 9.5% | 1.5% | 4.5% | 3.2% | 1.7% | 11 of 20 | 92% | 7.4 | |
| 103 | Metal containers | 19.1% | 27.0% | 21.6% | 0.7% | 6.9% | 6.4% | 2.7% | 3.2% | 14 of 20 | 70% | 6.0 |
| 104 | Hardware | 4.4% | 11.7% | 17.5% | 1.8% | 6.6% | 5.0% | 2.9% | 2.8% | 17 of 20 | 85% | 1.5 |
| 105 | Plumbing fixtures & fittings | 8.7% | 11.1% | 5.4% | 1.9% | 3.5% | 3.4% | 2.5% | 2.7% | 20 of 20 | 100% | 3.5 |
| 106 | Heating equipment | 7.1% | 14.5% | 21.3% | 0.4% | 8.3% | 6.4% | 4.1% | 4.0% | 20 of 20 | 100% | 1.7 |
| 107 | Fabricated structural metal products | 7.7% | 14.2% | 41.6% | 2.2% | 13.0% | 9.7% | 4.9% | 4.5% | 17 of 20 | 85% | 1.6 |
| 108 | Miscellaneous metal products | 6.6% | 10.9% | 14.0% | 0.7% | 5.1% | 4.3% | 2.1% | 2.4% | 17 of 20 | 85% | 3.2 |
| 11 | Machinery & equipment | 7.8% | 10.1% | 7.1% | 1.0% | 3.2% | 2.6% | 1.5% | 1.2% | 15 of 20 | 75% | 5.0 |
| 111 | Agricultural machinery & equipment | 10.1% | 16.2% | 14.6% | 1.0% | 5.8% | 4.3% | 2.8% | 2.9% | 20 of 20 | 100% | 3.7 |
| 112 | Construction machinery & equipment | 8.5% | 13.4% | 10.1% | 1.2% | 4.4% | 3.5% | 2.6% | 2.8% | 20 of 20 | 100% | 3.2 |
| 113 | Metalworking machinery & equipment | 6.7% | 9.5% | 7.3% | 0.7% | 3.1% | 2.7% | 1.9% | 1.8% | 18 of 20 | 90% | 3.6 |
| 114 | General purpose machinery & equipment | 12.2% | 15.3% | 10.1% | 1.8% | 4.6% | 4.0% | 2.8% | 3.0% | 20 of 20 | 100% | 4.3 |
| 1141 | Pumps, compressors, and equipment | 14.6% | 16.0% | 7.6% | 0.7% | 3.1% | 3.2% | 2.6% | 3.1% | 20 of 20 | 100% | 4.8 |
| 1142 | Elevators, escalators, and other lifts | 4.3% | 17.3% | 16.7% | 0.9% | 7.1% | 5.3% | 3.4% | 2.4% | 16 of 20 | 80% | 1.8 |
| 1143 | Fluid power equipment | 10.9% | 13.7% | 8.7% | 1.1% | 4.0% | 3.3% | 2.4% | 3.0% | 20 of 20 | 100% | 3.6 |
| 1144 | Industrial material handling equipment | 7.6% | 12.9% | 14.4% | 1.7% | 5.6% | 4.6% | 3.4% | 3.3% | 19 of 20 | 95% | 2.3 |
| 1145 | Mechanical power transmission equipment | 12.3% | 13.7% | 8.0% | 1.7% | 3.8% | 3.4% | 2.3% | 3.1% | 18 of 20 | 90% | 4.0 |
| 1146 | Scales and balances | 7.4% | 9.0% | 11.9% | 1.1% | 4.8% | 5.3% | 3.9% | 2.9% | 20 of 20 | 100% | 2.5 |
| 1147 | Air purif. equip. & indust./commerc. fans/blowers | 9.2% | 10.1% | 9.6% | 1.8% | 4.9% | 4.0% | 2.9% | 2.8% | 19 of 20 | 95% | 3.2 |
| 1148 | Air conditioning and refrigeration equip | 19.0% | 24.9% | 14.7% | 2.6% | 6.7% | 5.4% | 3.3% | 2.8% | 19 of 20 | 95% | 6.8 |
| 114902 | Metal valves, except fluid power | 12.3% | 14.2% | 4.9% | 2.8% | 3.2% | 3.6% | 3.2% | 4.1% | 20 of 20 | 100% | 3.0 |
| 114903 | Metal pipe fittings, flanges, and unions | 14.1% | 16.0% | 14.4% | 13.6% | 9.5% | 7.8% | 3.5% | 3.4% | 15 of 20 | 75% | 4.1 |
| 116 | Special industry machinery & equipment | 8.4% | 10.0% | 11.6% | 2.1% | 5.1% | 3.7% | 2.3% | 2.0% | 19 of 20 | 95% | 3.6 |
| 118 | Miscellaneous instruments | 7.6% | 9.2% | 3.5% | 1.3% | 2.3% | 2.1% | 1.8% | 1.8% | 20 of 20 | 100% | 4.2 |
| 119 | Miscellaneous machinery | 4.9% | 6.6% | 4.1% | 0.8% | 2.1% | 1.8% | 1.1% | 1.8% | 17 of 20 | 85% | 4.5 |
| 12 | Furniture & household durables | 7.1% | 9.3% | 10.9% | 1.6% | 4.7% | 3.9% | 2.4% | 2.1% | 20 of 20 | 100% | 3.0 |
| 121 | Household furniture | 7.1% | 10.0% | 13.3% | 0.9% | 5.4% | 4.3% | 2.7% | 2.5% | 19 of 20 | 95% | 2.6 |
| 122 | Commercial furniture | 10.0% | 12.0% | 12.5% | 1.9% | 5.5% | 4.8% | 2.9% | 2.7% | 18 of 20 | 90% | 3.4 |
| 124 | Household appliances | 8.5% | 10.5% | 8.3% | 1.9% | 4.4% | 3.7% | 1.9% | 1.3% | 12 of 20 | 60% | 4.5 |
| 126 | Other household durable goods | 5.0% | 6.6% | 9.8% | 2.6% | 4.5% | 3.2% | 2.1% | 1.8% | 20 of 20 | 100% | 2.4 |
| 13 | Nonmetallic mineral products | 12.2% | 13.8% | 7.8% | 2.1% | 3.8% | 3.5% | 3.0% | 3.3% | 19 of 20 | 95% | 4.0 |
| 131 | Glass | 6.6% | 8.9% | 6.5% | 3.3% | 3.7% | 3.0% | 2.8% | 1.5% | 15 of 20 | 75% | 2.4 |
| 132 | Concrete ingredients & related products | 11.9% | 11.9% | 4.1% | 3.8% | 3.7% | 3.7% | 3.6% | 3.8% | 19 of 20 | 95% | 3.3 |
| 133 | Concrete products | 12.5% | 15.4% | 8.4% | 2.7% | 4.6% | 4.0% | 3.6% | 3.5% | 17 of 20 | 85% | 3.5 |
| 134 | Clay construction products ex. refractories | 5.8% | 7.2% | 5.4% | 2.0% | 2.9% | 1.9% | 1.5% | 1.3% | 15 of 20 | 75% | 3.8 |
| 135 | Refractories | 10.3% | 11.1% | 7.2% | 0.5% | 4.3% | 3.8% | 2.7% | 3.5% | 18 of 20 | 90% | 3.8 |
| 136 | Asphalt felts & coatings | 16.4% | 14.9% | 11.7% | 2.3% | 4.2% | 5.1% | 1.9% | 4.8% | 11 of 20 | 55% | 8.7 |
| 137 | Gypsum products | 16.5% | 18.6% | 20.2% | 3.7% | 6.1% | 6.0% | 6.9% | 4.4% | 15 of 20 | 75% | 2.4 |
| 138 | Glass containers | 10.9% | 12.4% | 6.8% | 1.7% | 3.7% | 2.8% | 2.1% | 2.7% | 20 of 20 | 100% | 5.2 |
| 139 | Other nonmetallic minerals | 13.3% | 15.1% | 8.4% | -0.5% | 2.6% | 2.5% | 1.9% | 3.3% | 16 of 20 | 80% | 6.9 |
| 14 | Transportation equipment | 3.7% | 5.1% | 3.9% | 0.9% | 1.7% | 1.5% | 1.3% | 1.4% | 19 of 20 | 95% | 2.7 |
| 141 | Motor vehicles & equipment | 3.7% | 5.3% | 4.6% | 0.7% | 1.7% | 1.4% | 1.3% | 1.0% | 16 of 20 | 80% | 2.9 |
| 142 | Aircraft & aircraft equipment | 3.7% | 4.3% | 1.6% | 1.3% | 1.4% | 1.3% | 1.4% | 2.2% | 19 of 20 | 95% | 2.6 |
| 143 | Ships & boats | 4.6% | 6.1% | 5.2% | 1.3% | 3.2% | 2.4% | 1.8% | 2.7% | 20 of 20 | 100% | 2.6 |
| 149 | Transportation equipment, n.e.c. | 5.7% | 9.9% | 10.2% | 0.5% | 3.7% | 3.3% | 2.0% | 1.7% | 16 of 20 | 80% | 2.8 |
| 15 | Miscellaneous products | 7.4% | 9.0% | 6.3% | 2.8% | 4.3% | 3.6% | 2.7% | 2.5% | 18 of 20 | 90% | 2.8 |
| 151 | Toys, sporting goods, small arms, etc. | 7.7% | 9.7% | 9.7% | 0.3% | 4.8% | 2.9% | 2.0% | 1.7% | 16 of 20 | 80% | 3.8 |
| 152 | Tobacco products, incl. stemmed & redried | 9.1% | 10.7% | 7.7% | 6.4% | 6.8% | 6.3% | 5.5% | 4.3% | 18 of 20 | 90% | 1.7 |
| 153 | Notions | 6.4% | 13.5% | 12.6% | 0.6% | 4.8% | 3.6% | 2.2% | 3.1% | 18 of 20 | 90% | 2.9 |
| 154 | Photographic equipment & supplies | 8.5% | 10.3% | 7.2% | -0.1% | 4.7% | 3.4% | 2.0% | 1.5% | 12 of 20 | 60% | 4.3 |
| 155 | Mobile homes | 8.3% | 15.0% | 30.1% | 8.6% | 15.4% | 11.0% | 6.8% | 5.2% | 20 of 20 | 100% | 1.2 |
| 156 | Medical, surgical & personal aid devices | 3.3% | 3.8% | 1.3% | 1.1% | 1.3% | 1.2% | 1.0% | 1.1% | 20 of 20 | 100% | 3.4 |
| 157 | Other industrial safety equipment | 7.4% | 9.2% | 7.0% | 2.9% | 3.0% | 2.0% | 2.1% | 1.8% | 18 of 20 | 90% | 3.5 |
| 159 | Other miscellaneous products | 12.0% | 14.9% | 8.7% | 2.1% | 5.4% | 4.0% | 2.2% | 2.3% | 18 of 20 | 90% | 5.4 |
| Business or Industry Type | Count | Business or Industry Type | Count |
| Machinery Manufacturing | 40 | Beverage and Tobacco Product Manufacturing | 7 |
| Merchant Wholesalers, Durable Goods | 29 | Wood Product Manufacturing | 7 |
| Chemical Manufacturing | 27 | Electrical Equip., Appliance & Component Mfg. | 7 |
| Fabricated Metal Product Manufacturing | 26 | Textile & Textile Product Mills | 7 |
| Petroleum and Coal Products Manufacturing | 23 | Plastics and Rubber Products Manufacturing | 6 |
| Food Manufacturing | 21 | Printing and Related Support Activities | 6 |
| Transportation Equipment Manufacturing | 18 | Clothing and Clothing Accessories Stores | 6 |
| Merchant Wholesalers, Nondurable Goods | 17 | Publishing Industries (except Internet) | 6 |
| Paper Manufacturing | 16 | Steel Pipe And Tubes | 5 |
| Primary Metal Manufacturing | 13 | Leather and Allied Product Manufacturing | 4 |
| Miscellaneous Retailers | 13 | Mining (except Oil and Gas) | 4 |
| Food and Beverage Stores | 12 | Miscellaneous Manufacturing | 4 |
| General Merchandise Stores | 10 | Apparel Manufacturing | 4 |
| Motor Vehicle and Parts Dealers | 9 | Nonmetallic Mineral Product Manufacturing | 3 |
| Furniture and Related Product Manufacturing | 8 | Furniture and Home Furnishings Stores | 3 |
| Computer and Electronic Product Manufacturing | 8 | Health and Personal Care Stores | 3 |
| Primary Business Activity or Product | Primary Business Activity or Product |
| Auto and Home Supply Stores | Industrial Supplies |
| Beer and Ale | Industrial Trucks, Tractors, Trailers & Stackers |
| Beverage and Tobacco Product Manufacturing | Industrial Valves |
| Bolts, Nuts, Screws, Rivets & Washers | Laboratory Apparatus and Furniture |
| Building Material and Garden Equipment and Supplies Dealers | Lighting Equipment |
| Chemical Manufacturing | Lumber and Other Building Materials Dealers |
| Department Stores | Machinery Manufacturing |
| Drugs, Drug Proprietaries & Druggists’ Sundries | Metals Service Centers |
| Durable and Non-Durable Goods Wholesalers | Construction Machinery & Heavy Duty Equipment |
| Electrical Machinery, Equipment & Supplies | Navigation, Measuring, Medical & Control Instruments |
| Electrical Machinery, Equipment, Appliance & Component Mfg. | Nonmetallic Mineral Product Manufacturing |
| Fabricated Metal Product Manufacturing | Paper Manufacturing |
| Fabricated Pipe and Pipe Fittings | Petroleum and Coal Products Manufacturing |
| Fabricated Plate Work (Boiler Shops) | Plastics and Rubber Products Manufacturing |
| Fabricated Structural Metal | Plastics Foam Products |
| Farm and Garden Machinery and Equipment | Plastics Material Synthetic Resins & Nonvulcanizable Elastomers |
| Farm Supplies | Plastics Materials and Basic Forms and Shapes |
| Food and Beverage Stores | Plumbing and Heating Equipment and Supplies (Hydronics) |
| Food Manufacturing | Power, Distribution & Specialty Transformers |
| Furniture and Home Furnishings Stores | Primary Metal Manufacturing |
| Furniture and Related Product Manufacturing | Publishing Industries (except Internet) |
| Gaskets, Packing & Sealing Devices | Pumps and Pumping Equipment |
| Gasoline Stations | Recreational Vehicle Dealers |
| General Industrial Machinery and Equipment | Steel Works, Blast Furnaces (Inc. Coke Ovens) & Rolling Mills |
| General Merchandise Stores | Tobacco and Tobacco Products |
| Hand and Edge Tools, Except Machine Tools and Handsaws | Transportation Equipment Manufacturing |
| Hardware Stores | Variety Stores |
| Health and Personal Care Stores | Warm Air Heating and Air-Conditioning Equipment and Supplies |
| Industrial & Commercial Fans & Blowers & Air Purification Equipment | Wines, Brandy & Brandy Spirits |
| Industrial Machinery and Equipment | Wood Product Manufacturing |
| Requirement |
Financial Reporting |
Tax |
| IRS Form 970 Application to Use LIFO Inventory Method & statement attachment must be filed with federal tax return in year of adoption |
|
|
| Opening (beginning) inventories must be valued at cost for a company’s first year on LIFO |
|
|
| Ending inventories must be valued using FIFO, earliest acquisitions or average cost |
|
|
| Must be used for financial reporting & tax purposes for all periods beginning in year of election |
|
|
| Financial reporting LIFO election scope must be equal to or greater than Tax scope (i.e. goods on LIFO for tax purposes can not be greater than what is on LIFO for financial reporting) |
|
|
| Prior lower of cost or market writedowns must be restored through income over a three-year period |
|
1. Complimentary Offerings – LIFO-PRO delivers the essentials when it comes to LIFO analysis & review, including the following complimentary offerings:
a. LIFO Election Benefit Analysis – LIFO-PRO provides CPA firms this complimentary consulting service to quickly determine if a client/prospect is a good candidate for LIFO. All we need to initially get started is either the company’s primary business activity or URL. From there, LIFO-PRO utilizes our 25+ years of historical inflation data covering all industries to turn around a quick yes or no answer on if LIFO would make sense for any given client. Refer to the Sample LIFO Election Benefit Analysis Report in Appendix A of this guide for further information.
b. Best LIFO Practices Methods Review – LIFO-PRO offers this complimentary consulting service to review a company’s LIFO calculation, documentation and methods to determine the following:
i. LIFO calculation accuracy
ii. LIFO methods conformity/compliance
iii. LIFO policies & procedures optimization recommendations
The finished product provided to CPA firms and their client is a Best LIFO Practices Methods Review Report. This valuable resource can ensure LIFO calculation accuracy, reduce IRS audit exposure risk and provide great planning opportunities. Refer to the Sample Best LIFO Practices Methods Review Report in the Appendix of this guide for further information.
2. Software Licenses – Minimize time spent on LIFO, increase LIFO calculation accuracy & maximize reporting transparency with our software. CPA firms can also make quick work of identifying if a client or prospect is a good LIFO candidate using the software! CPA firms can use their software license as a powerful tool to generate more tax savings opportunities in less time!
3. Turnkey LIFO Outsourcing Solutions – Regardless of it’s a client that’s making a first-time LIFO election or one that’s already on LIFO, we have a solution that allows both CPA firms and companies to pass 100% of their LIFO workload off to us. LIFO-PRO handles all aspects of the LIFO calculation and delivers a complete set of LIFO-PRO Reports to the CPA and client.
4. LIFO Consulting Services – Aside from our complimentary consulting services (LIFO Election Benefit Analysis & Best LIFO Practices Methods Review), LIFO-PRO offers the following consulting services (can be bundled or stand-alone):
a. Producer Price Index (PPI) category assignments
b. IRS LIFO election form preparation (Form 970 & statement attachment)
c. IRS accounting method change form preparation (Form 3115 & statement attachment)
d. Accounting method changes –
i. Changing from internal to externally calculated inflation indexes (IPIC)
ii. Changing from double-extension to link-chain
iii. Changing from CPI to PPI
e. Restatements & retrospective adjustments
f. Pool combinations/splits
g. Rebasing LIFO layer history
LIFO-PRO’s clientele has combined annual sales in excess of $1 trillion. The total inventory balances calculated by the LIFO-PRO software exceeds $100 billion & our client’s combined LIFO reserve exceeds $15 billion. The software is used by over 60% of all department and grocery store retailer’s that use LIFO. Notable clients include:
Over 75 CPA firms work with LIFO-PRO directly or indirectly to provide LIFO solutions to their clientele & prospects; notable CPA firm partnerships include:
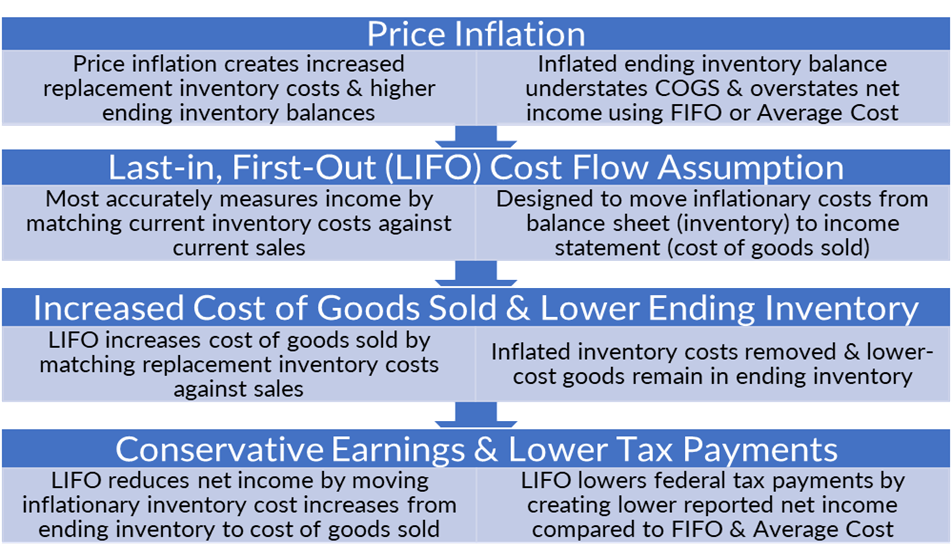
The Last-in, First-out method, also known as the LIFO method, is one of the four cost flow assumptions allowed by U.S. GAAP & the IRS (FIFO, average cost & specific identification are the three other acceptable methods). LIFO matches current inventory costs against current sales to provide a better measure of earnings. When there’s inflation, the effect of using LIFO is that the value of the most recently purchased, higher cost items are included in cost of goods sold while the older, lower cost goods remain in inventory. In other words, LIFO is designed to move some of the inflationary costs from the balance sheet (inventory) to the income statement (cost of goods sold).
The IRS Tax Court made the following statement about LIFO, “The theory behind LIFO is that income may be more accurately determined by matching current costs against current revenues, thereby eliminating from earnings any artificial profits resulting from inflationary increases in inventory costs. At the heart of the LIFO method is the principle that income is more clearly reflected by matching current costs with current revenues.” The cumulative difference between inventory valued at LIFO vs. a non-LIFO method (i.e. FIFO, average cost) is known as the LIFO reserve and the annual change between the current & prior period LIFO reserve is known as LIFO expense (income if current vs. prior period LIFO reserve decreases). The infographic shown below further illustrates the concept of how LIFO works:
In the 1930’s, inflation was causing increased replacement inventory costs, artificially high ending inventory balances, understated cost of goods sold & overstated earnings. The unintended consequence was having to pay additional taxes based on artificial income on inventory not yet sold. Because of this, a large number of companies & industry trade associations collaborated with the Special Committee on Inventories of the American Institute of Accountants (now known as the AICPA) to develop an alternative inventory method that matched current costs against sales, and thereby more clearly reflecting income. The Securities & Exchange Commission considered LIFO to be permissible for financial reporting purposes in 1936 & the AIA later advocated for LIFO to be allowed for both financial reporting & tax in 1938. The combined lobbying efforts of the AIA, corporations & trade associations eventually led to Congress accepting the use of the LIFO method for tax purposes when the Revenue Act of 1938 was passed.
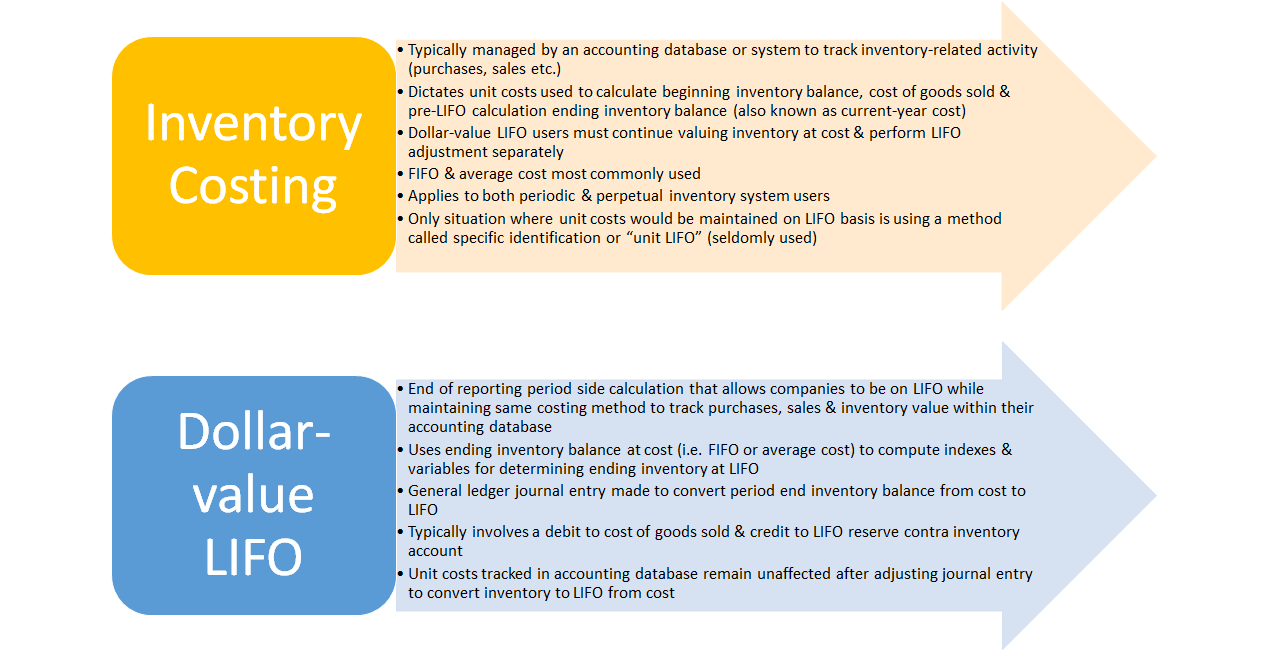
For dollar-value LIFO method users, a company will continue tracking inventory costs within their accounting database using the same method that was used prior to adopting LIFO. This means that beginning inventory, purchases, sales & cost of goods sold recorded during the reporting period continues to be valued any of the available non-LIFO methods (i.e. FIFO, average cost, earliest acquisitions etc.). Illustration 2 below provides an example of common inventory activity occurring during the course of a reporting period using FIFO or average cost:

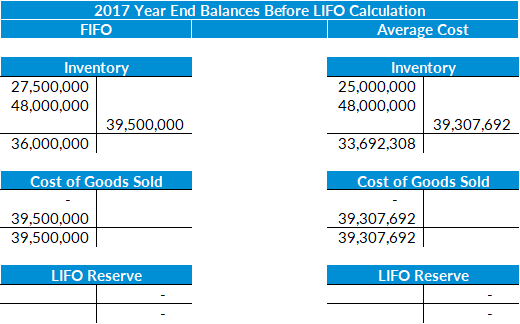
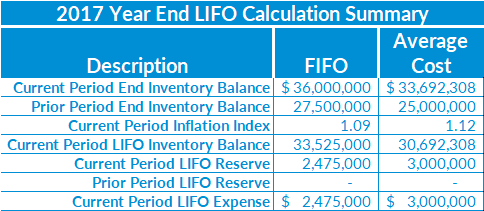

As shown in the calculation summary above, the LIFO inventory balance is between $2 – $3 million less than the current period end inventory balance at cost. This difference represents the LIFO expense (current – prior period LIFO reserve) & LIFO reserve balances (inventory at cost – LIFO inventory). It also represents how LIFO transfers inflationary inventory costs from the balance sheet (inventory) to the income statement (cost of goods sold). The debits and credits in the journal entry shown above represent increases to both cost of goods sold and the LIFO reserve contra inventory account. Since the LIFO reserve account is a contra inventory account, ending inventory gross of LIFO reserve represents inventory at cost & while ending inventory net of LIFO reserve represents inventory at LIFO. The cost of goods sold account is essentially the vehicle that allows for LIFO taxpayers to reduce their taxable income. Using the data from the illustrations above, the example below shows the 2017 year end balances after the LIFO general ledger adjusting journal entry has been made:
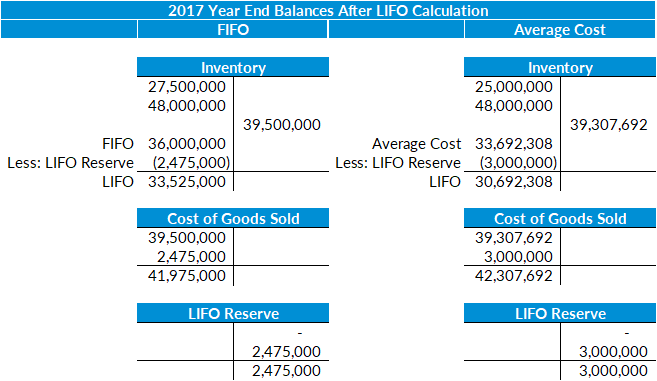
As shown above, the cost of goods sold account is now $2 – $3 million higher after the LIFO calculation. Aside from any other adjusting entries required after the LIFO calculation, this will be the amount used for financial reporting and tax purposes. Although the cost of goods sold account balance will be closed out after recording the closing entries, the LIFO reserve contra inventory account is a permanent account that will be carried forward into the next reporting period.
Using the data from the illustrations above, the examples shown below illustrate how inventory costs will be tracked when going from the first to the second reporting period on LIFO:

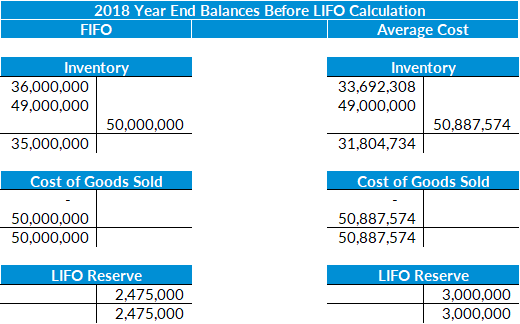
As shown above, beginning inventory, purchases, sales & cost of goods sold continue being valued at cost throughout the course of the second period on LIFO (will remain the case for all subsequent periods on LIFO). As explained earlier, the LIFO reserve contra inventory account remains in place because the beginning inventory balance net of LIFO reserve represents inventory at LIFO cost. The example below illustrates the year 2 LIFO calculation results along with the adjusting journal entries and post-LIFO calculation general ledger inventory balances:
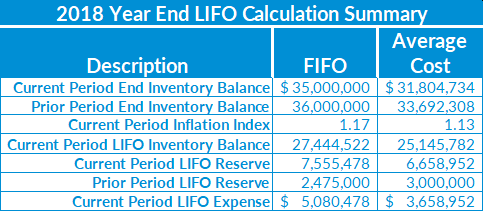

As shown above, the current period LIFO calculation resulted in 17% & 13% inflation for each of the two calculations that resulted in approximately $5 million & $3.7 million of LIFO expense (increase to cost of goods sold). Although the LIFO inventory balance is the difference between ending inventory gross and net of the current period LIFO reserve, the LIFO expense is the difference between the current & prior period LIFO reserve and represents the current period increase to cost of goods sold. Using the data from the illustrations above, the example below shows the 2018 year end balances after the LIFO general ledger adjusting journal entry has been made:
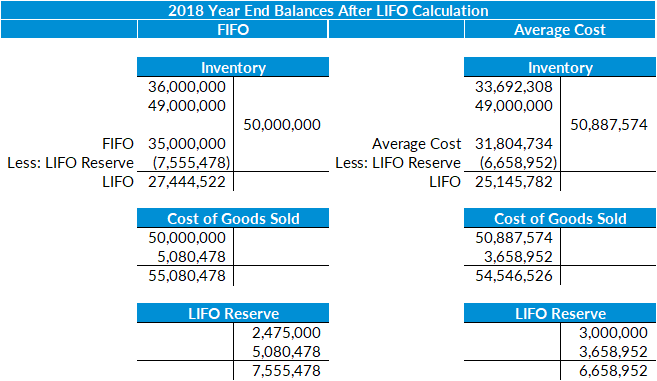
As illustrated above, the cost of goods sold account was increased in each of the two years shown and represents the vehicle for companies on LIFO to reduce their taxable income & tax liability. Using the 2018 year end (year 2) data from the illustrations above, the example below compare the differences in cost of goods sold, taxable income & federal income tax liability between LIFO, FIFO and average cost:
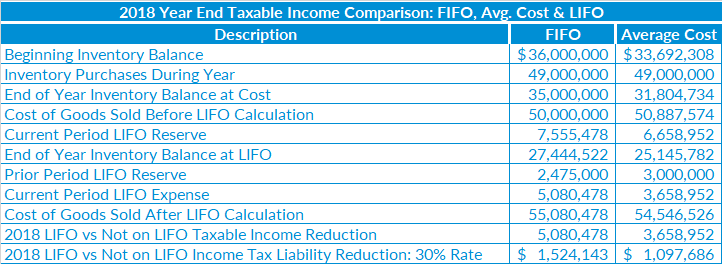
As shown above, there’s a $5 million & $1.5 million reduction in taxable income & federal income tax liability when comparing a LIFO vs. non-LIFO taxpayer that uses FIFO as their current-year cost method. Similarly, there’s a $3.5 million & $1.1 million reduction in taxable income & federal income tax liability when comparing a LIFO vs. non-LIFO taxpayer that uses average cost as their current-year cost method. It should be noted that this difference would also have been recognized in the first year on LIFO (prior period LIFO reserve amounts), and will recognition will continue in subsequent periods as long as there’s inflation. Another important concept is the fact that current period LIFO reserve grew despite the current vs. prior period ending inventory balance at cost decreasing. A common misconception exists that inventory balances must increase for the LIFO reserve to grow, but this is not the case. The LIFO reserve will continue to grow when the current vs. prior period end inventory balance is lower as long as the amount of inflation outpaces the amount of the inventory balance decrease.
| Requirement |
Financial Reporting |
Tax |
| IRS Form 970 Application to Use LIFO Inventory Method & statement attachment must be filed with federal tax return in year of adoption |
|
|
| Opening (beginning) inventories must be valued at cost for a company’s first year on LIFO |
|
|
| Ending inventories must be valued using FIFO, earliest acquisitions or average cost |
|
|
| Must be used for financial reporting & tax purposes for all periods beginning in year of election |
|
|
| Financial reporting LIFO election scope must be equal to or greater than Tax scope (i.e. goods on LIFO for tax purposes can not be greater than what is on LIFO for financial reporting) |
|
|
| Prior lower of cost or market writedowns must be restored through income over a three-year period |
|
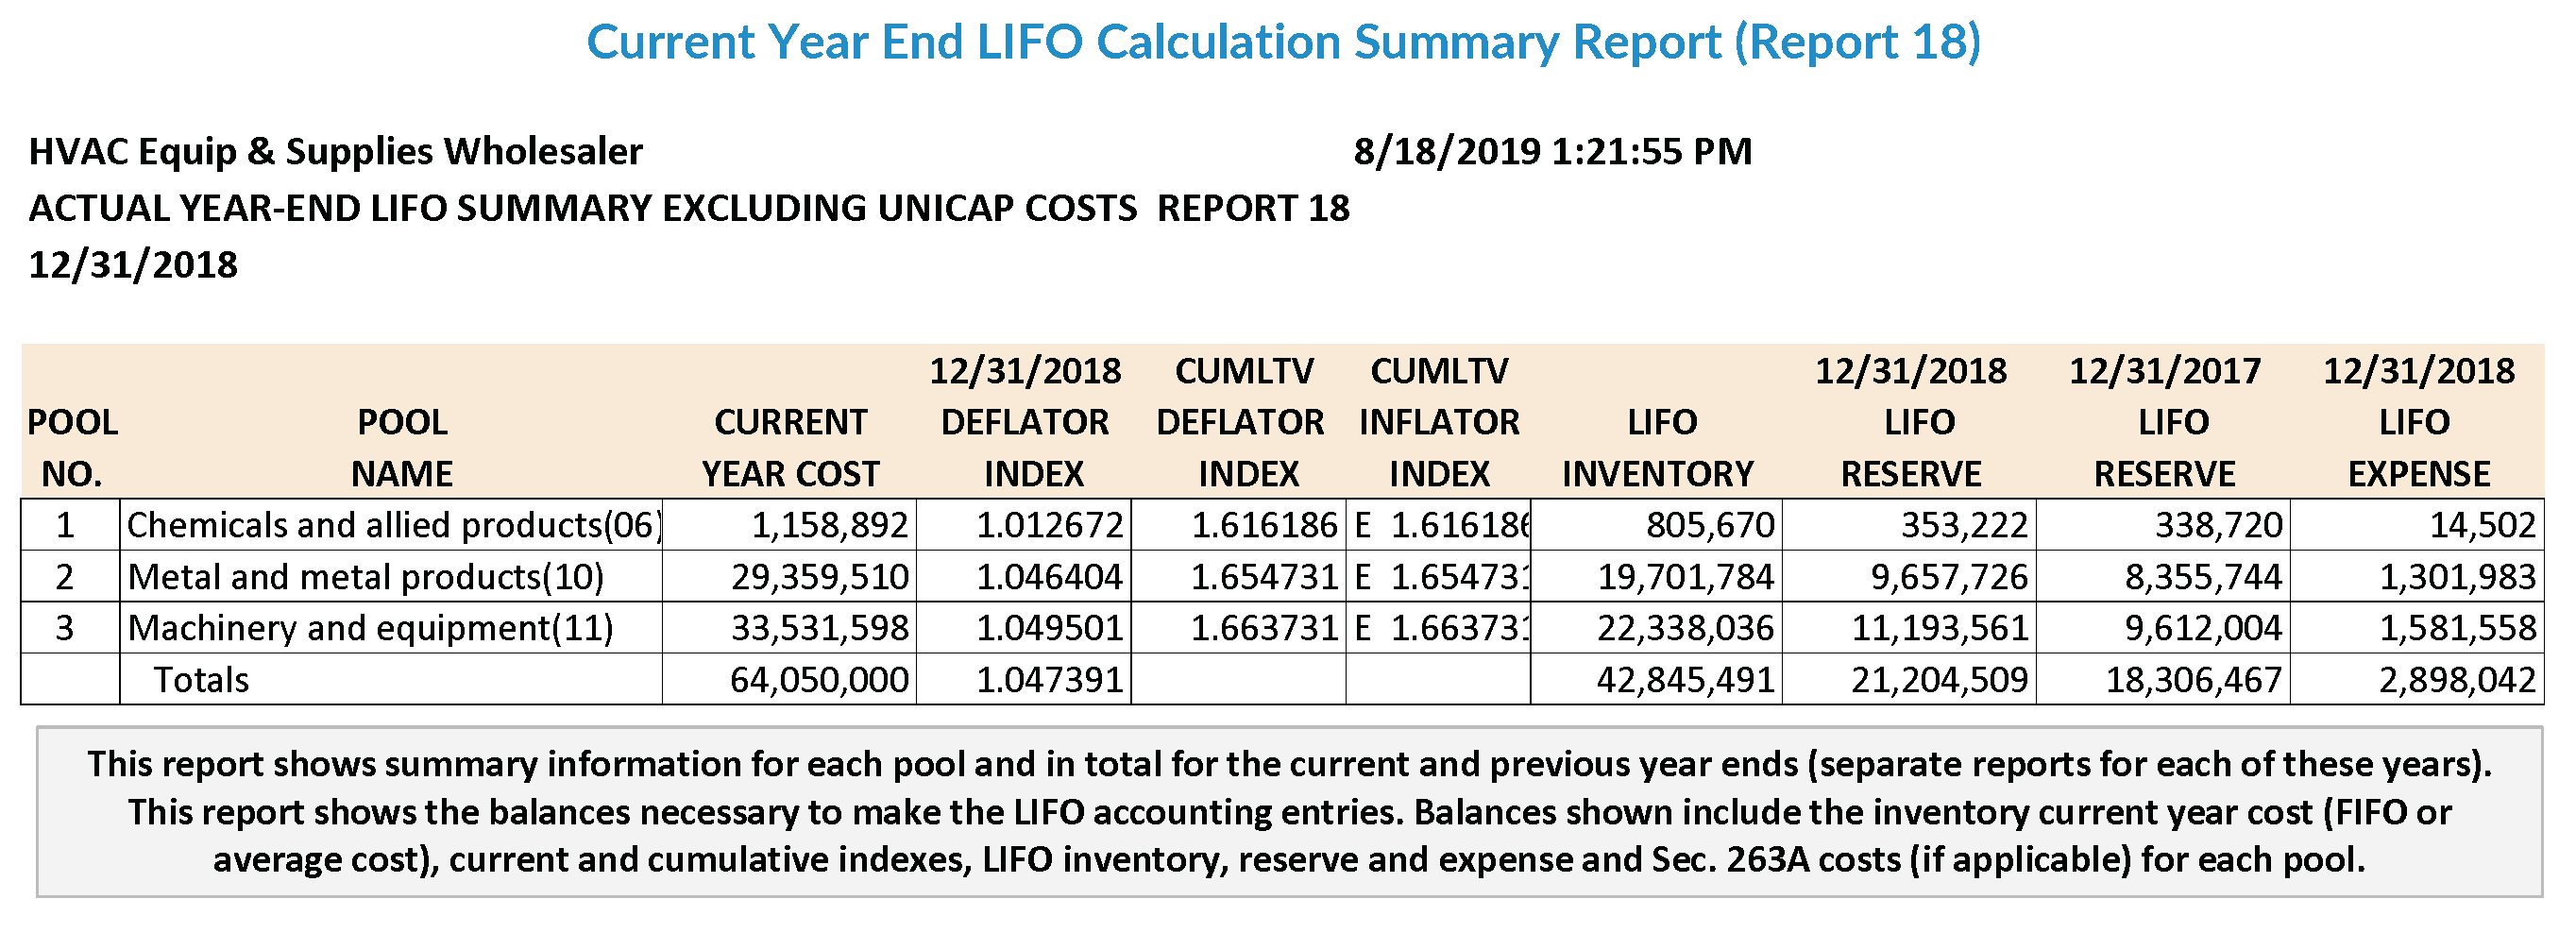
Actual Year End LIFO Summary Report (Report 18) – Shows summary information for each pool and in total for the current and previous year ends (separate reports for each of these years). This report shows the balances necessary to make the LIFO accounting entries. Balances shown include the inventory current year cost (FIFO or average cost), current and cumulative indexes, LIFO inventory, reserve and expense and Sec. 263A costs (if applicable) for each pool.
LIFO Reserve Calculation Report (Report 18a) – This is a more detailed version of Report 18 that shows all the steps necessary to calculate all years’ LIFO reserves and shows the details of decrement calculations where applicable. This report shows these calculations for all pools and in total for a given year. The bottom section of this report (except where retail LIFO is used) shows the breakdown of the LIFO expense or income components between the inflation index effect and the layer erosion effect. The latter is the pre-tax amount that is required by GAAP to be disclosed in the notes to the financial statements (if material) for financial reporting purposes.
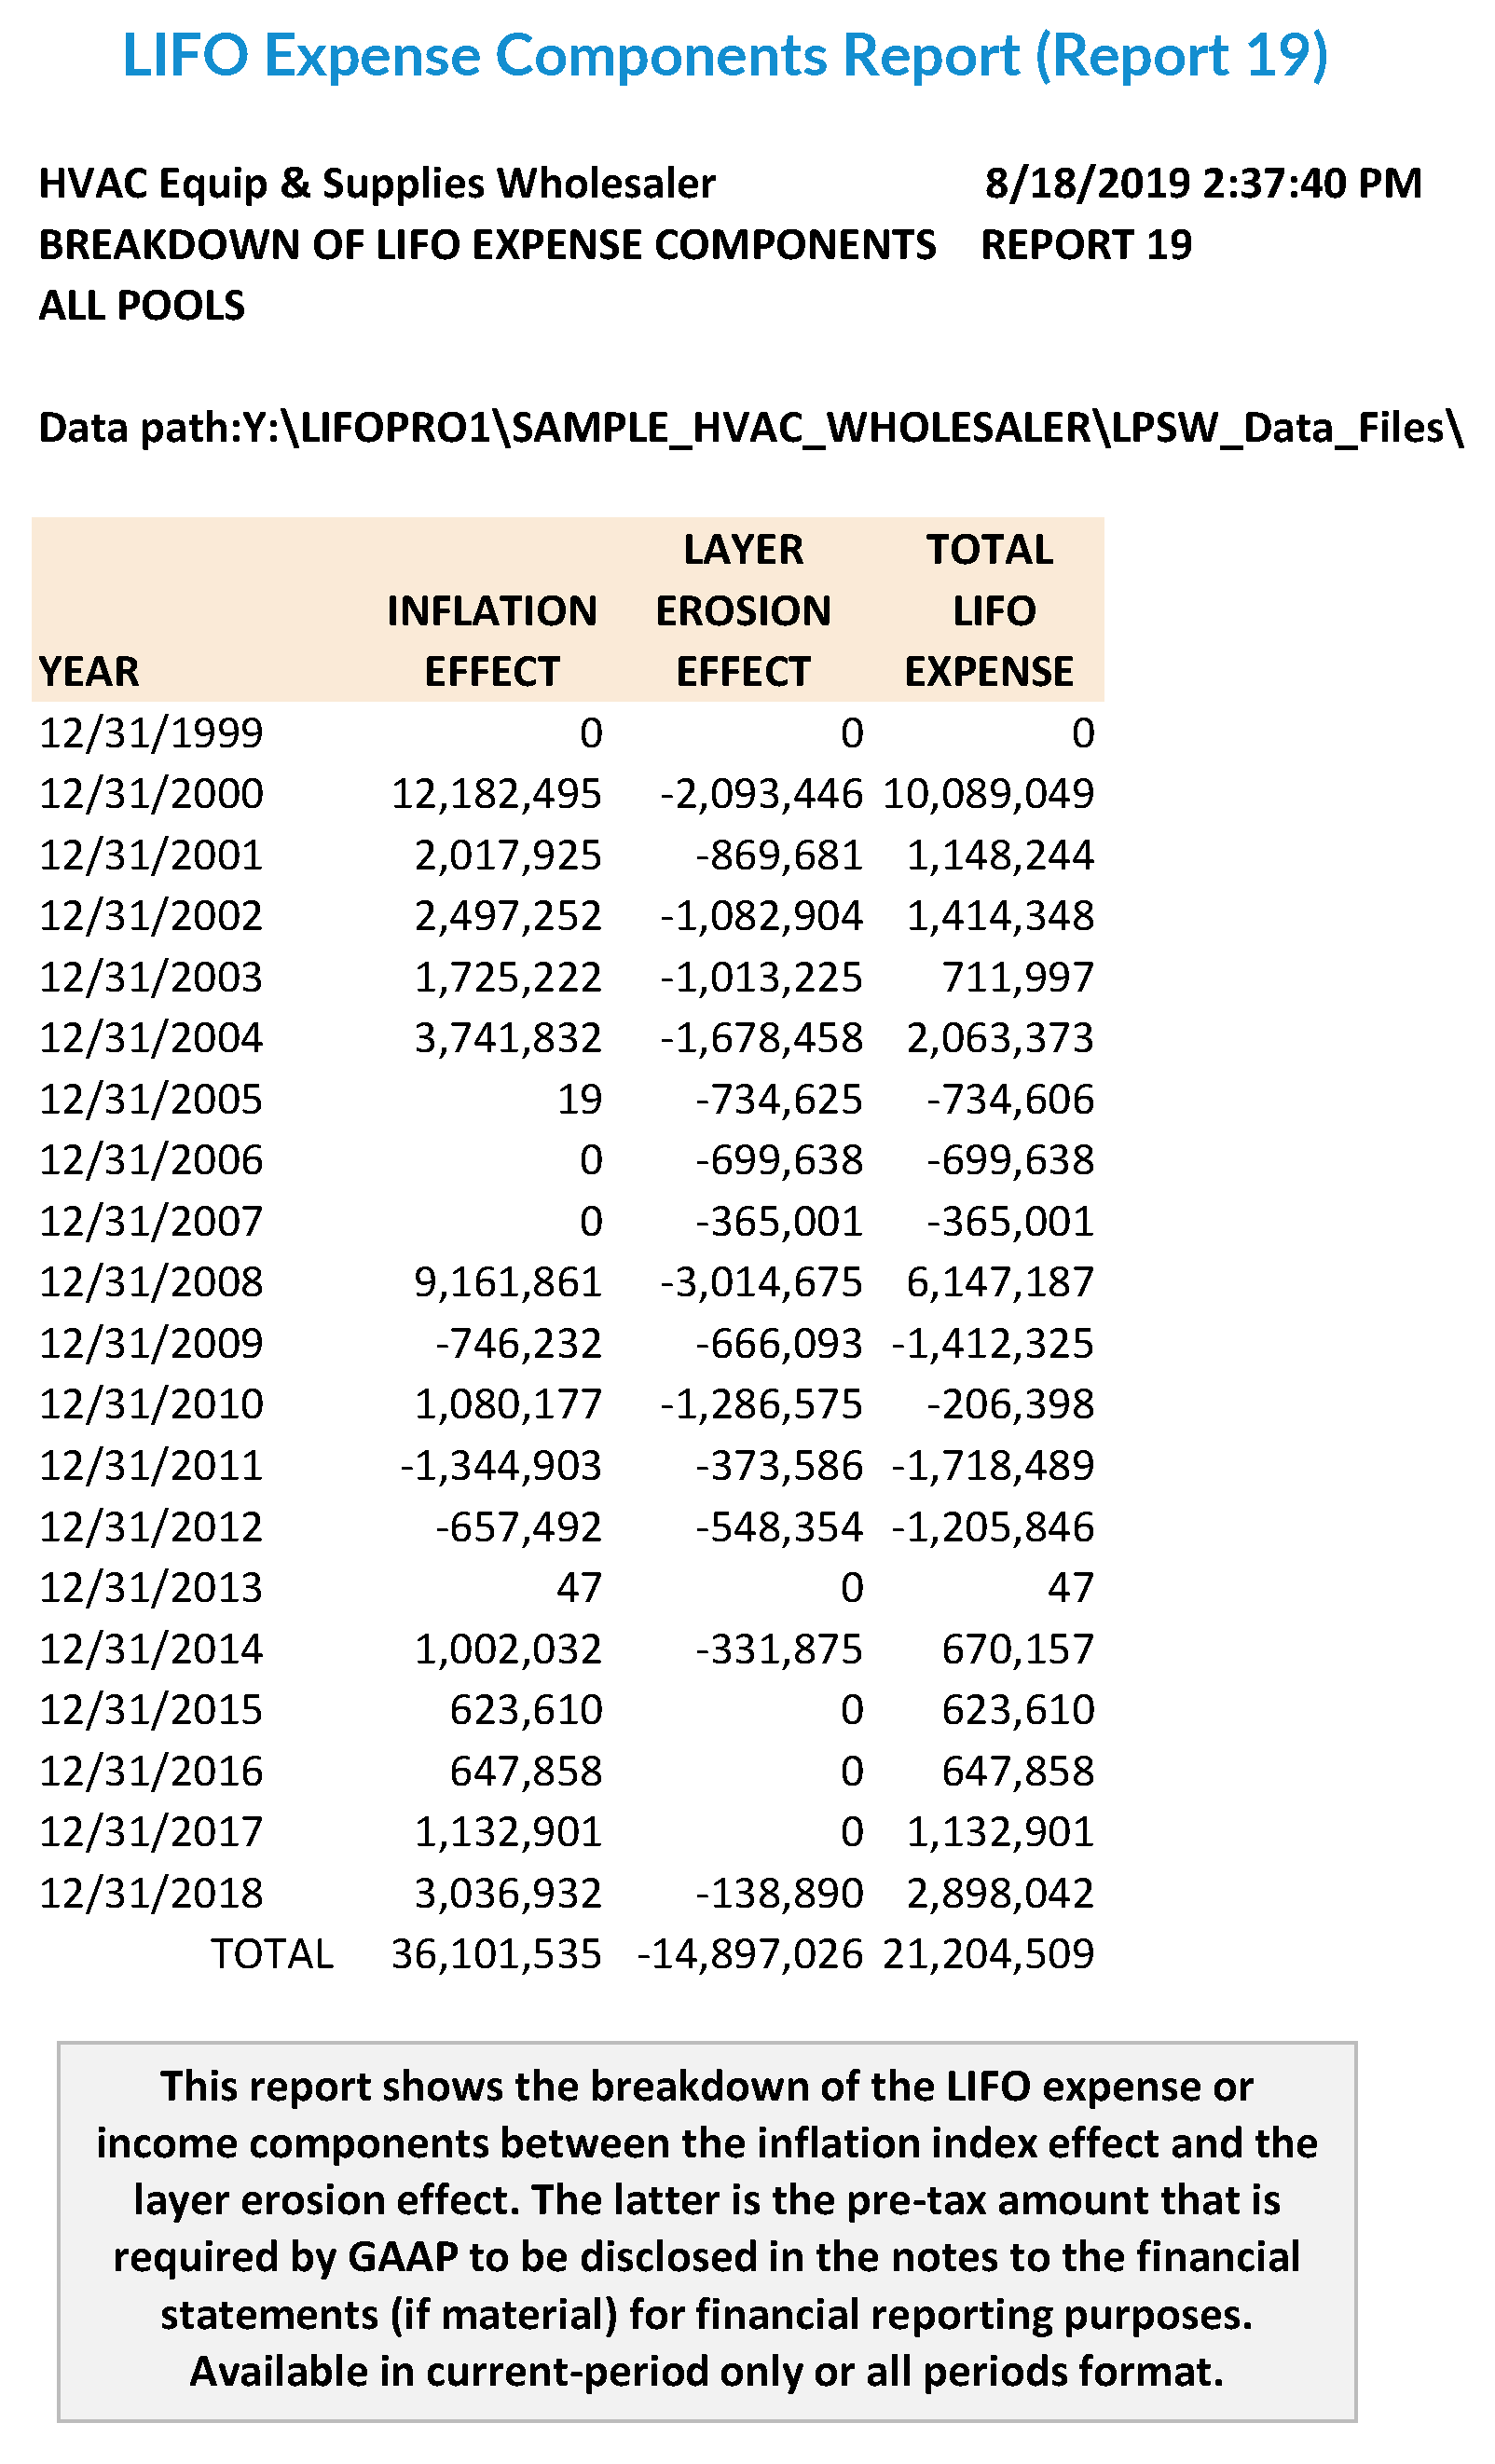
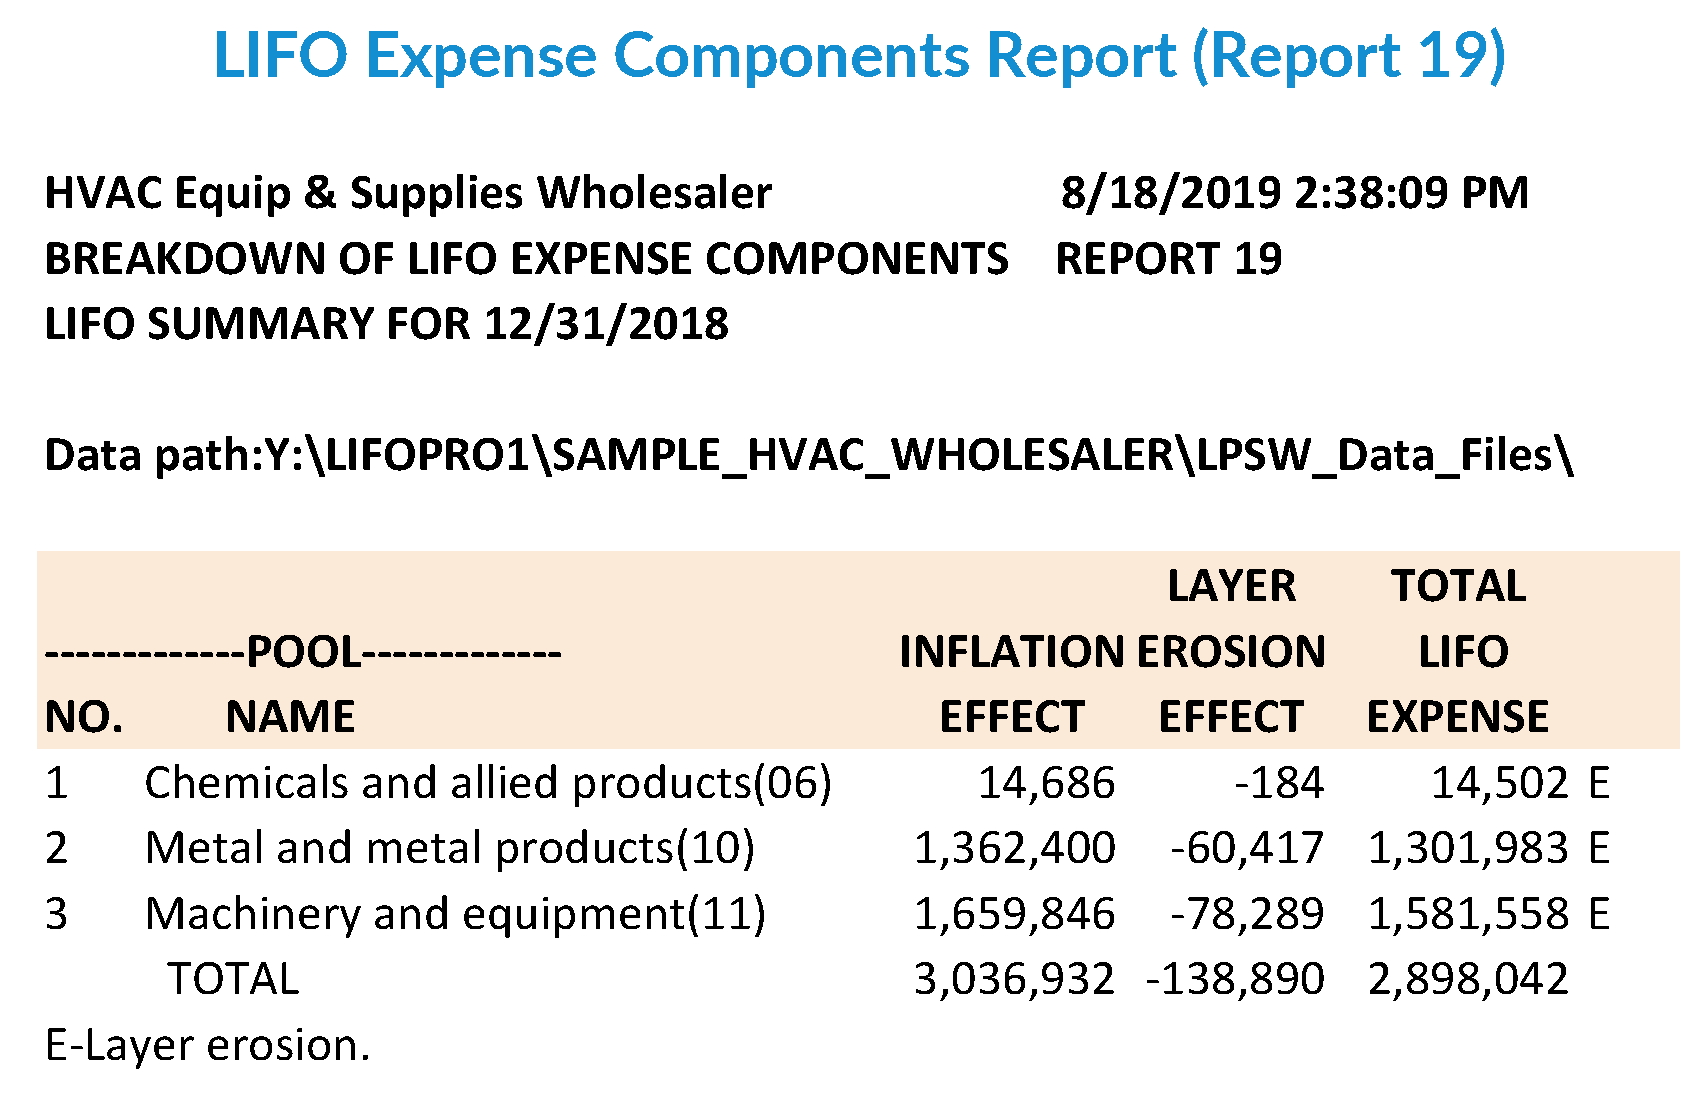
LIFO Expense Components Report (Report 19) – This report shows the breakdown of the LIFO expense or income components between the inflation index effect and the layer erosion effect. The latter is the pre-tax amount that is required by GAAP to be disclosed in the notes to the financial statements (if material) for financial reporting purposes. Available in current-period only or all periods format.
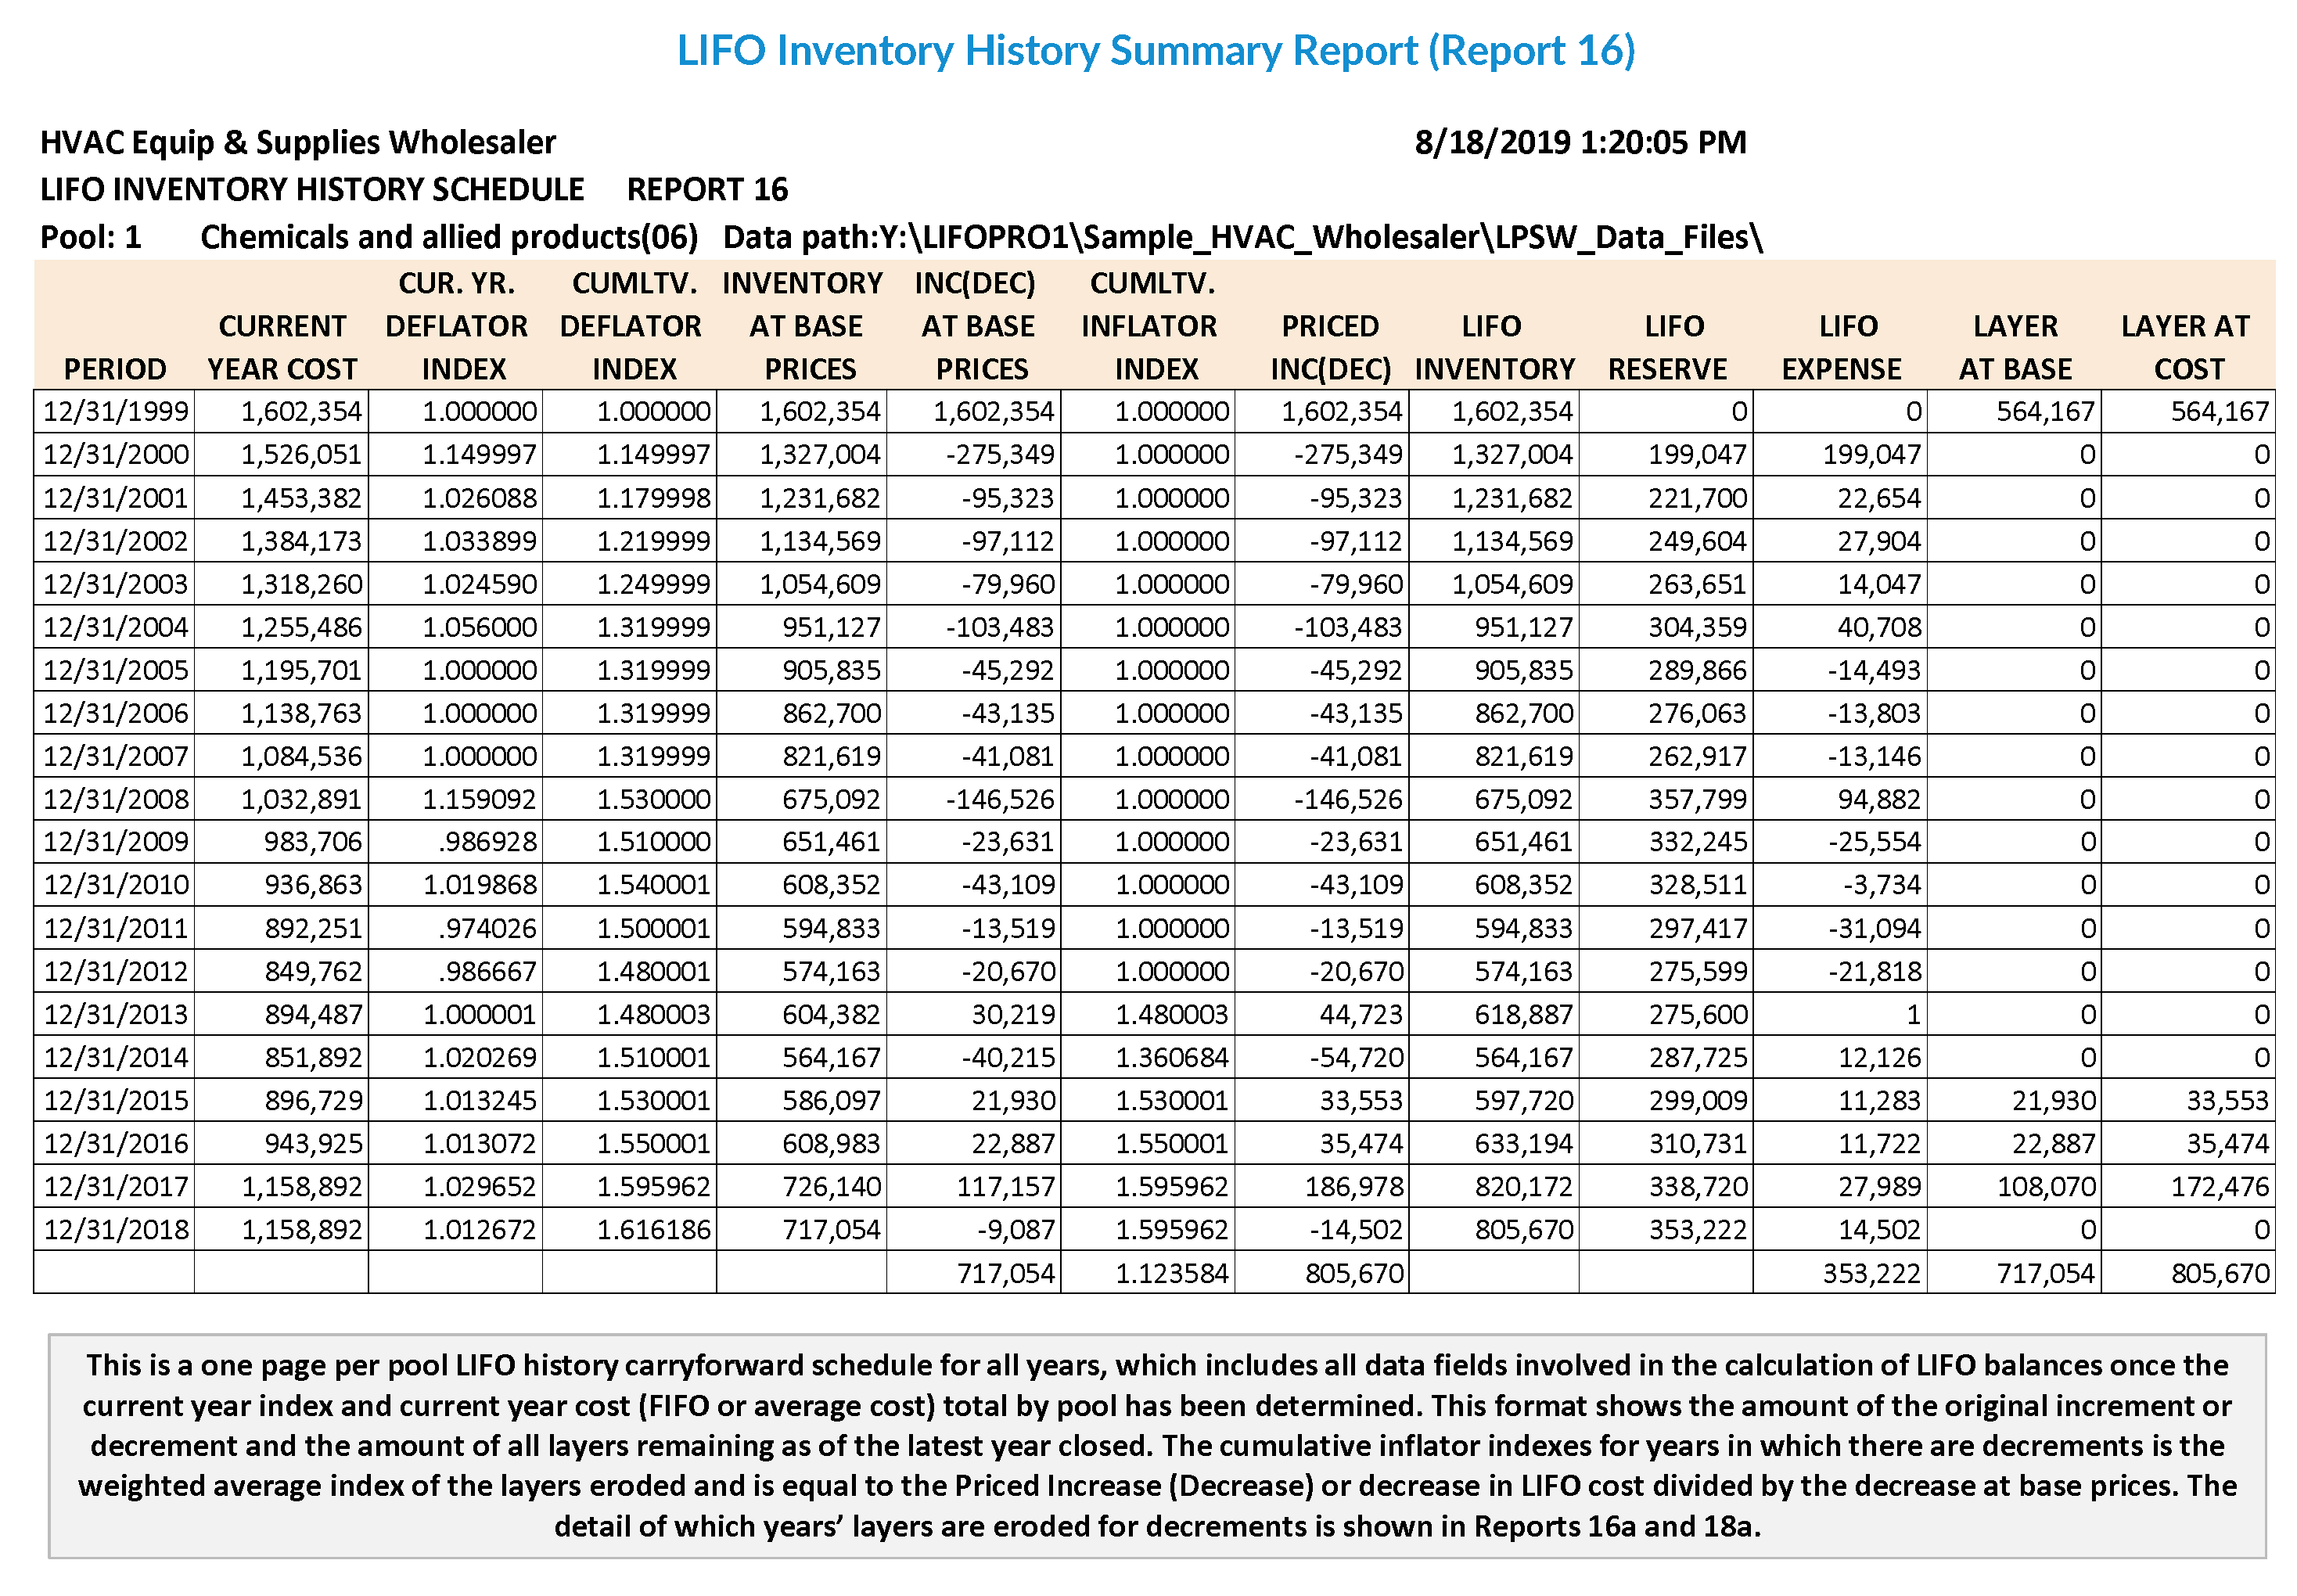
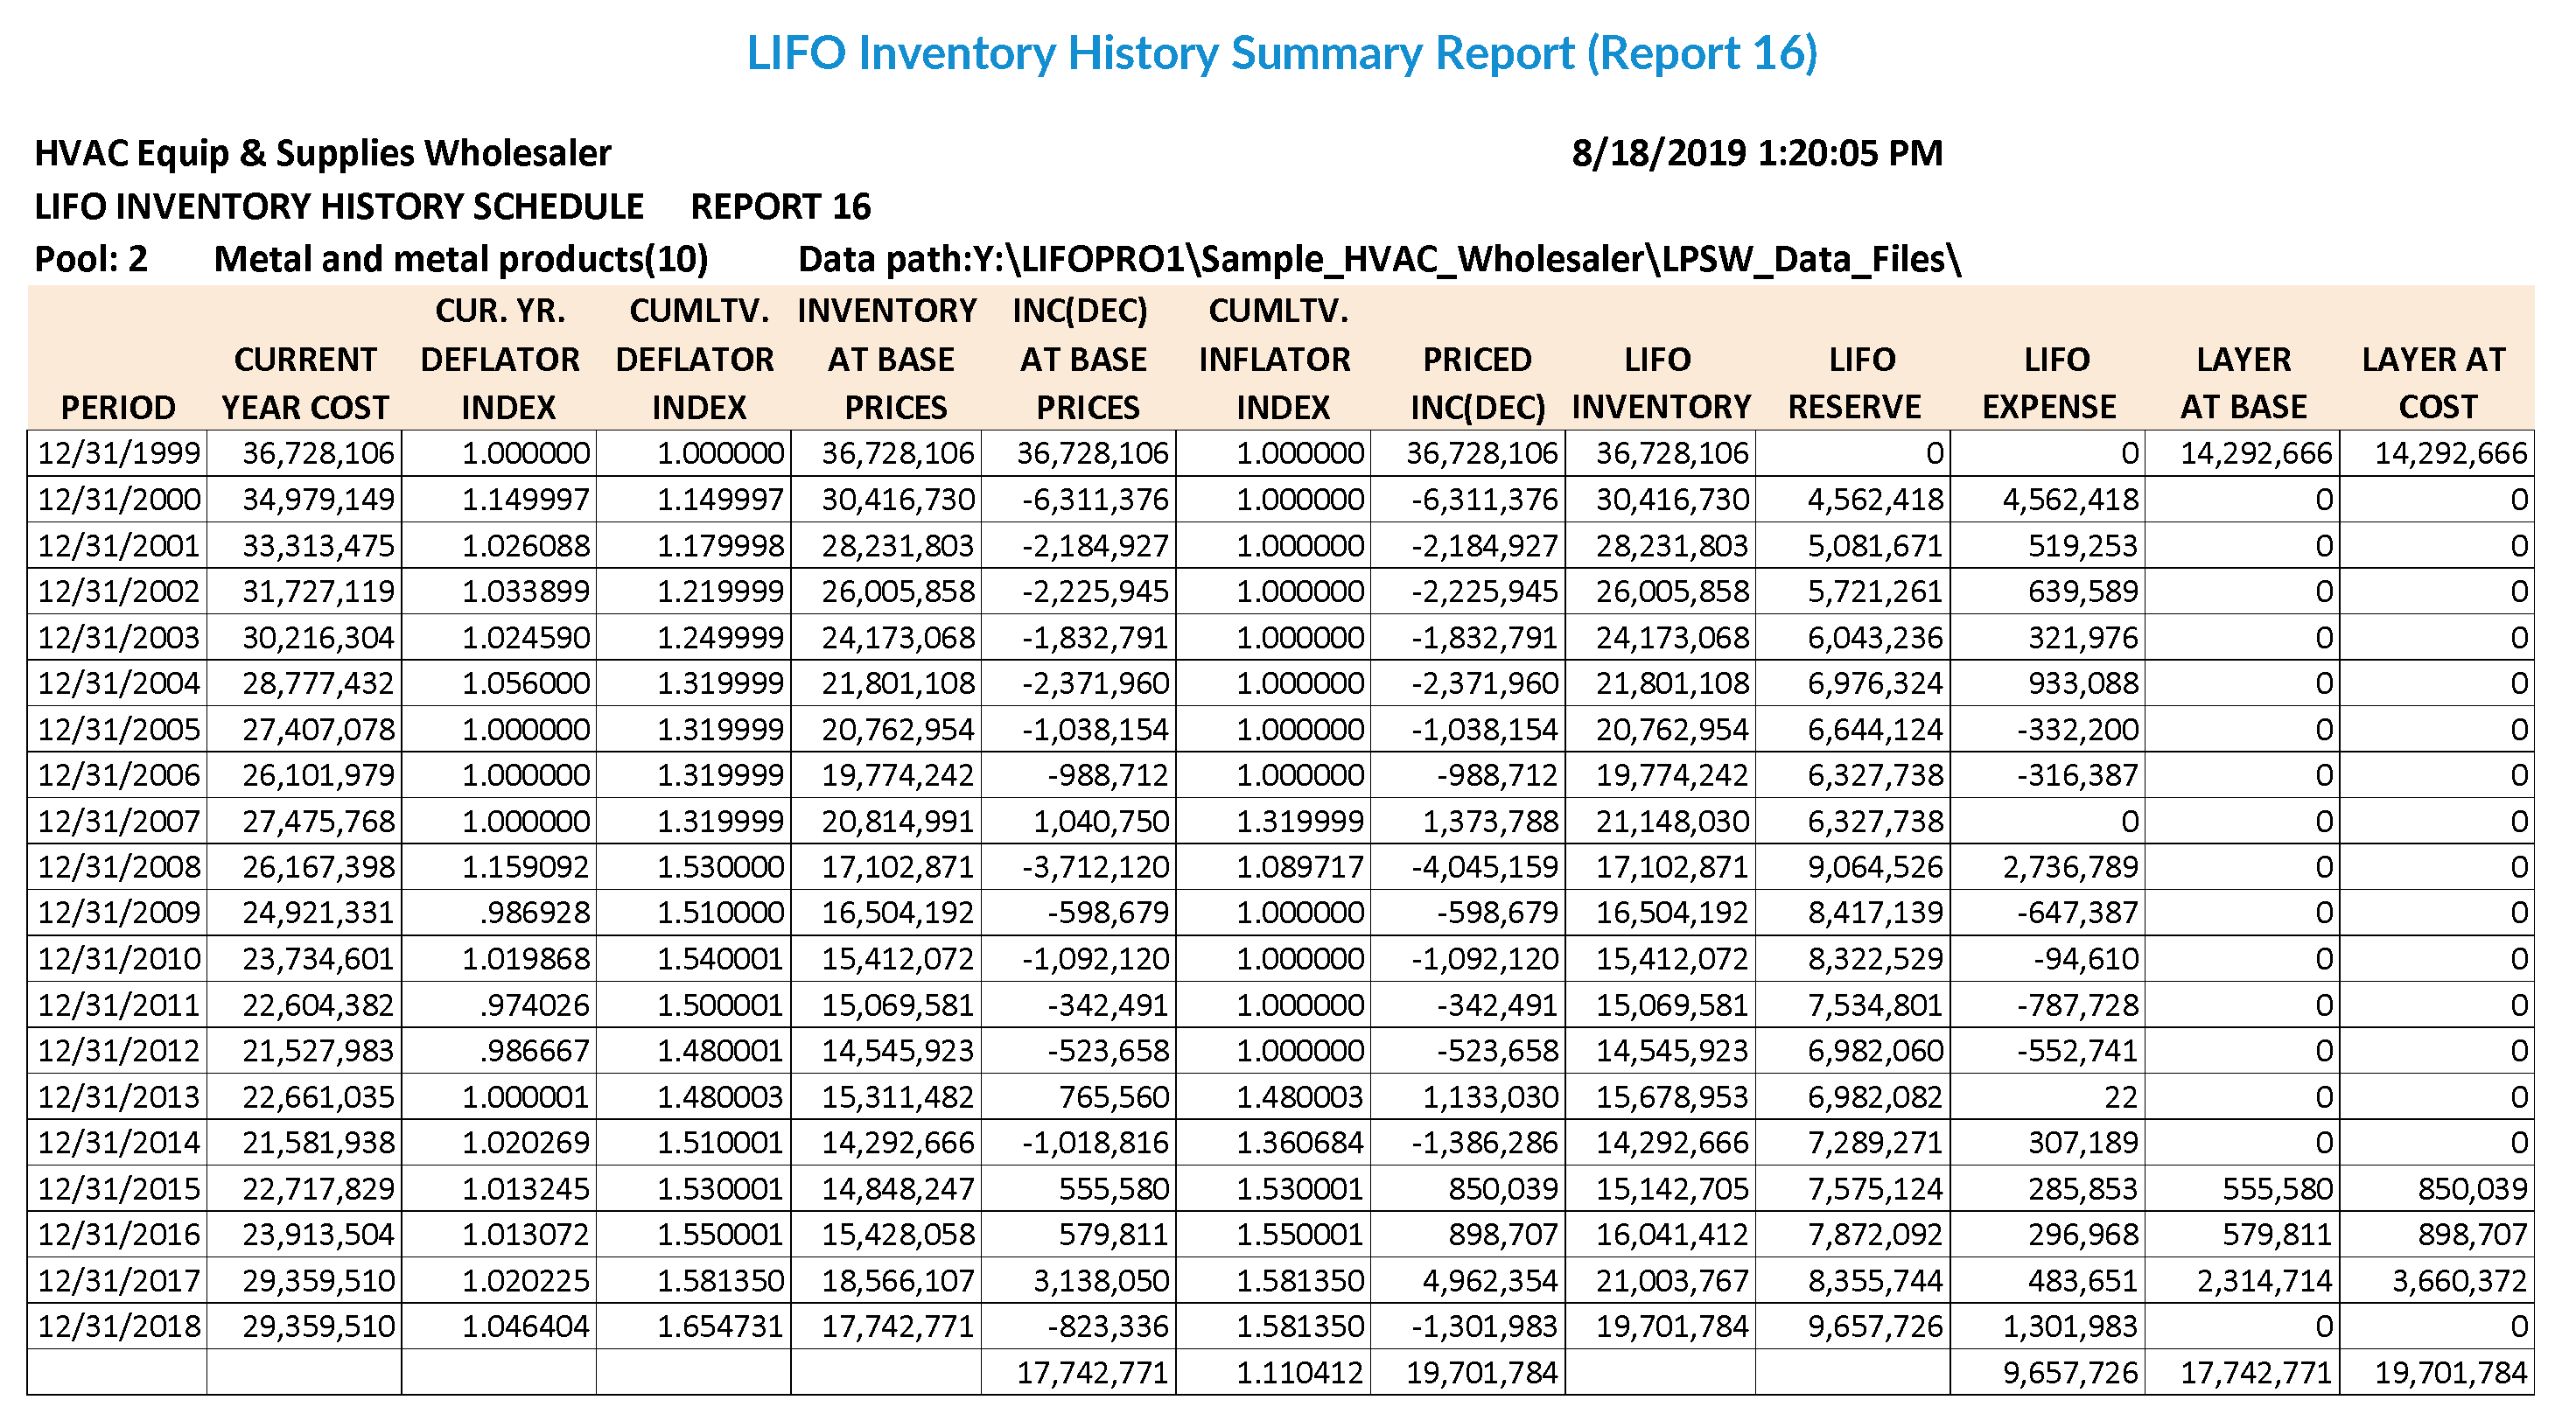
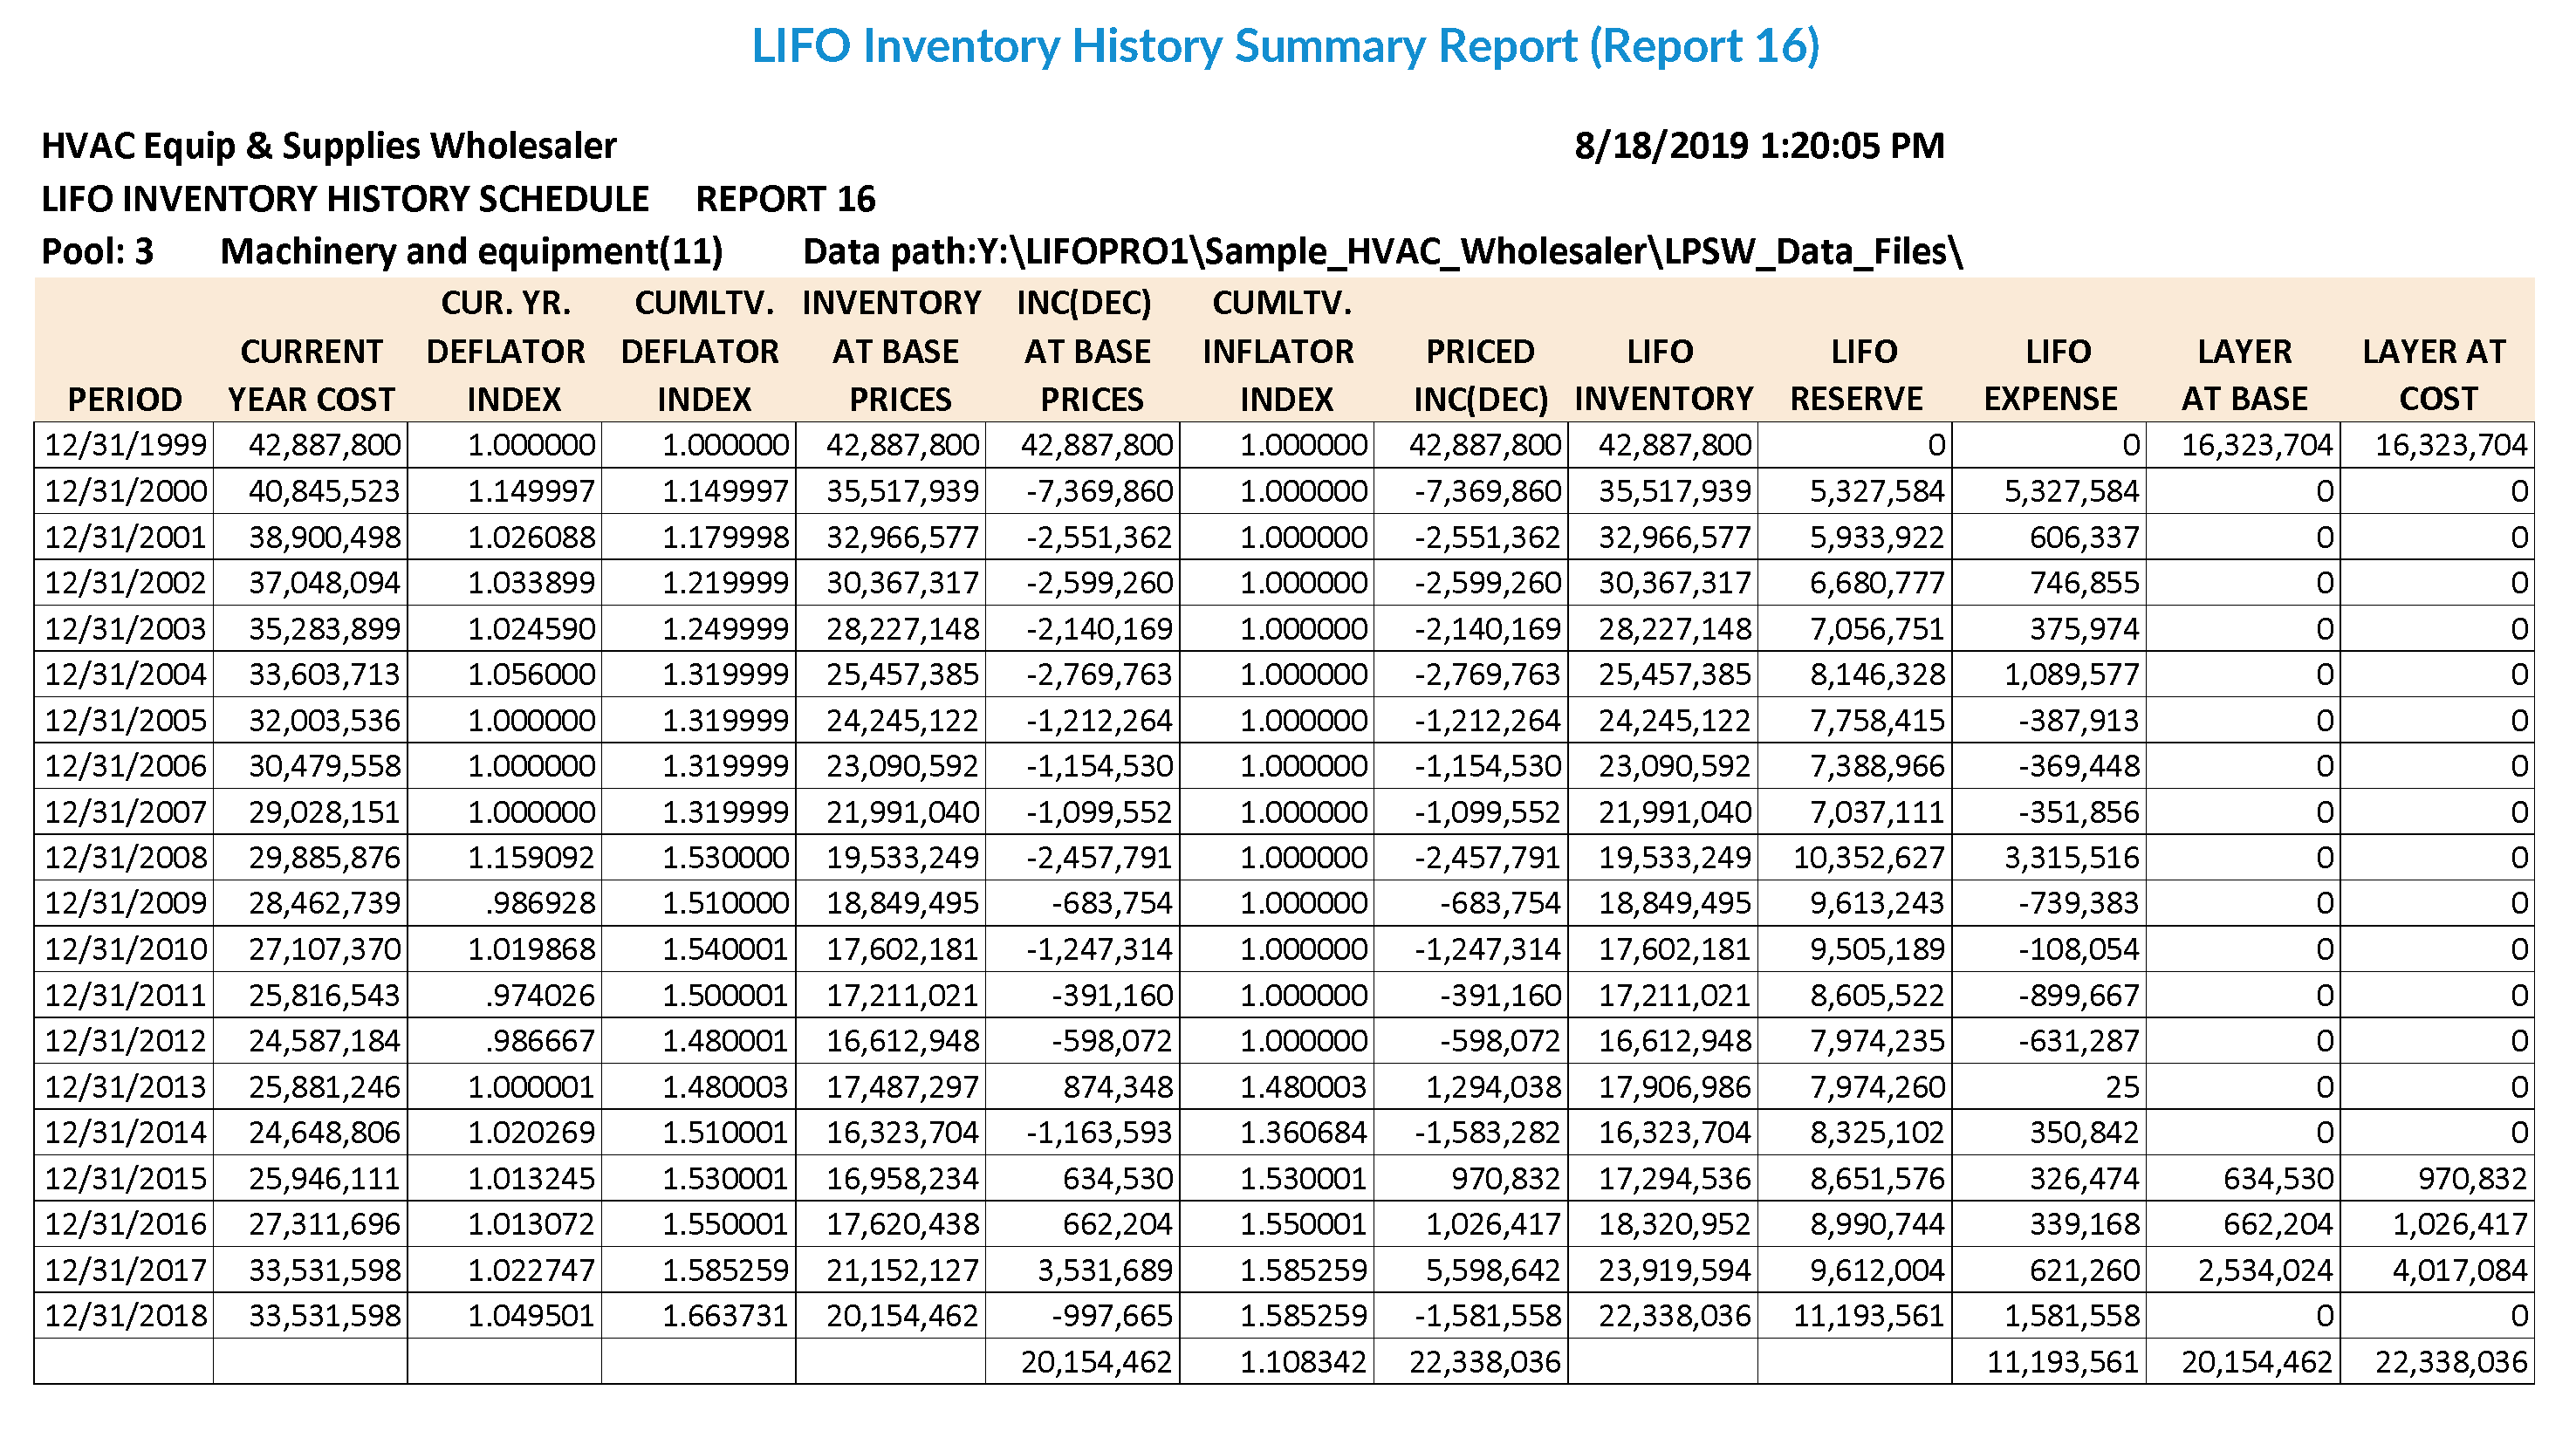
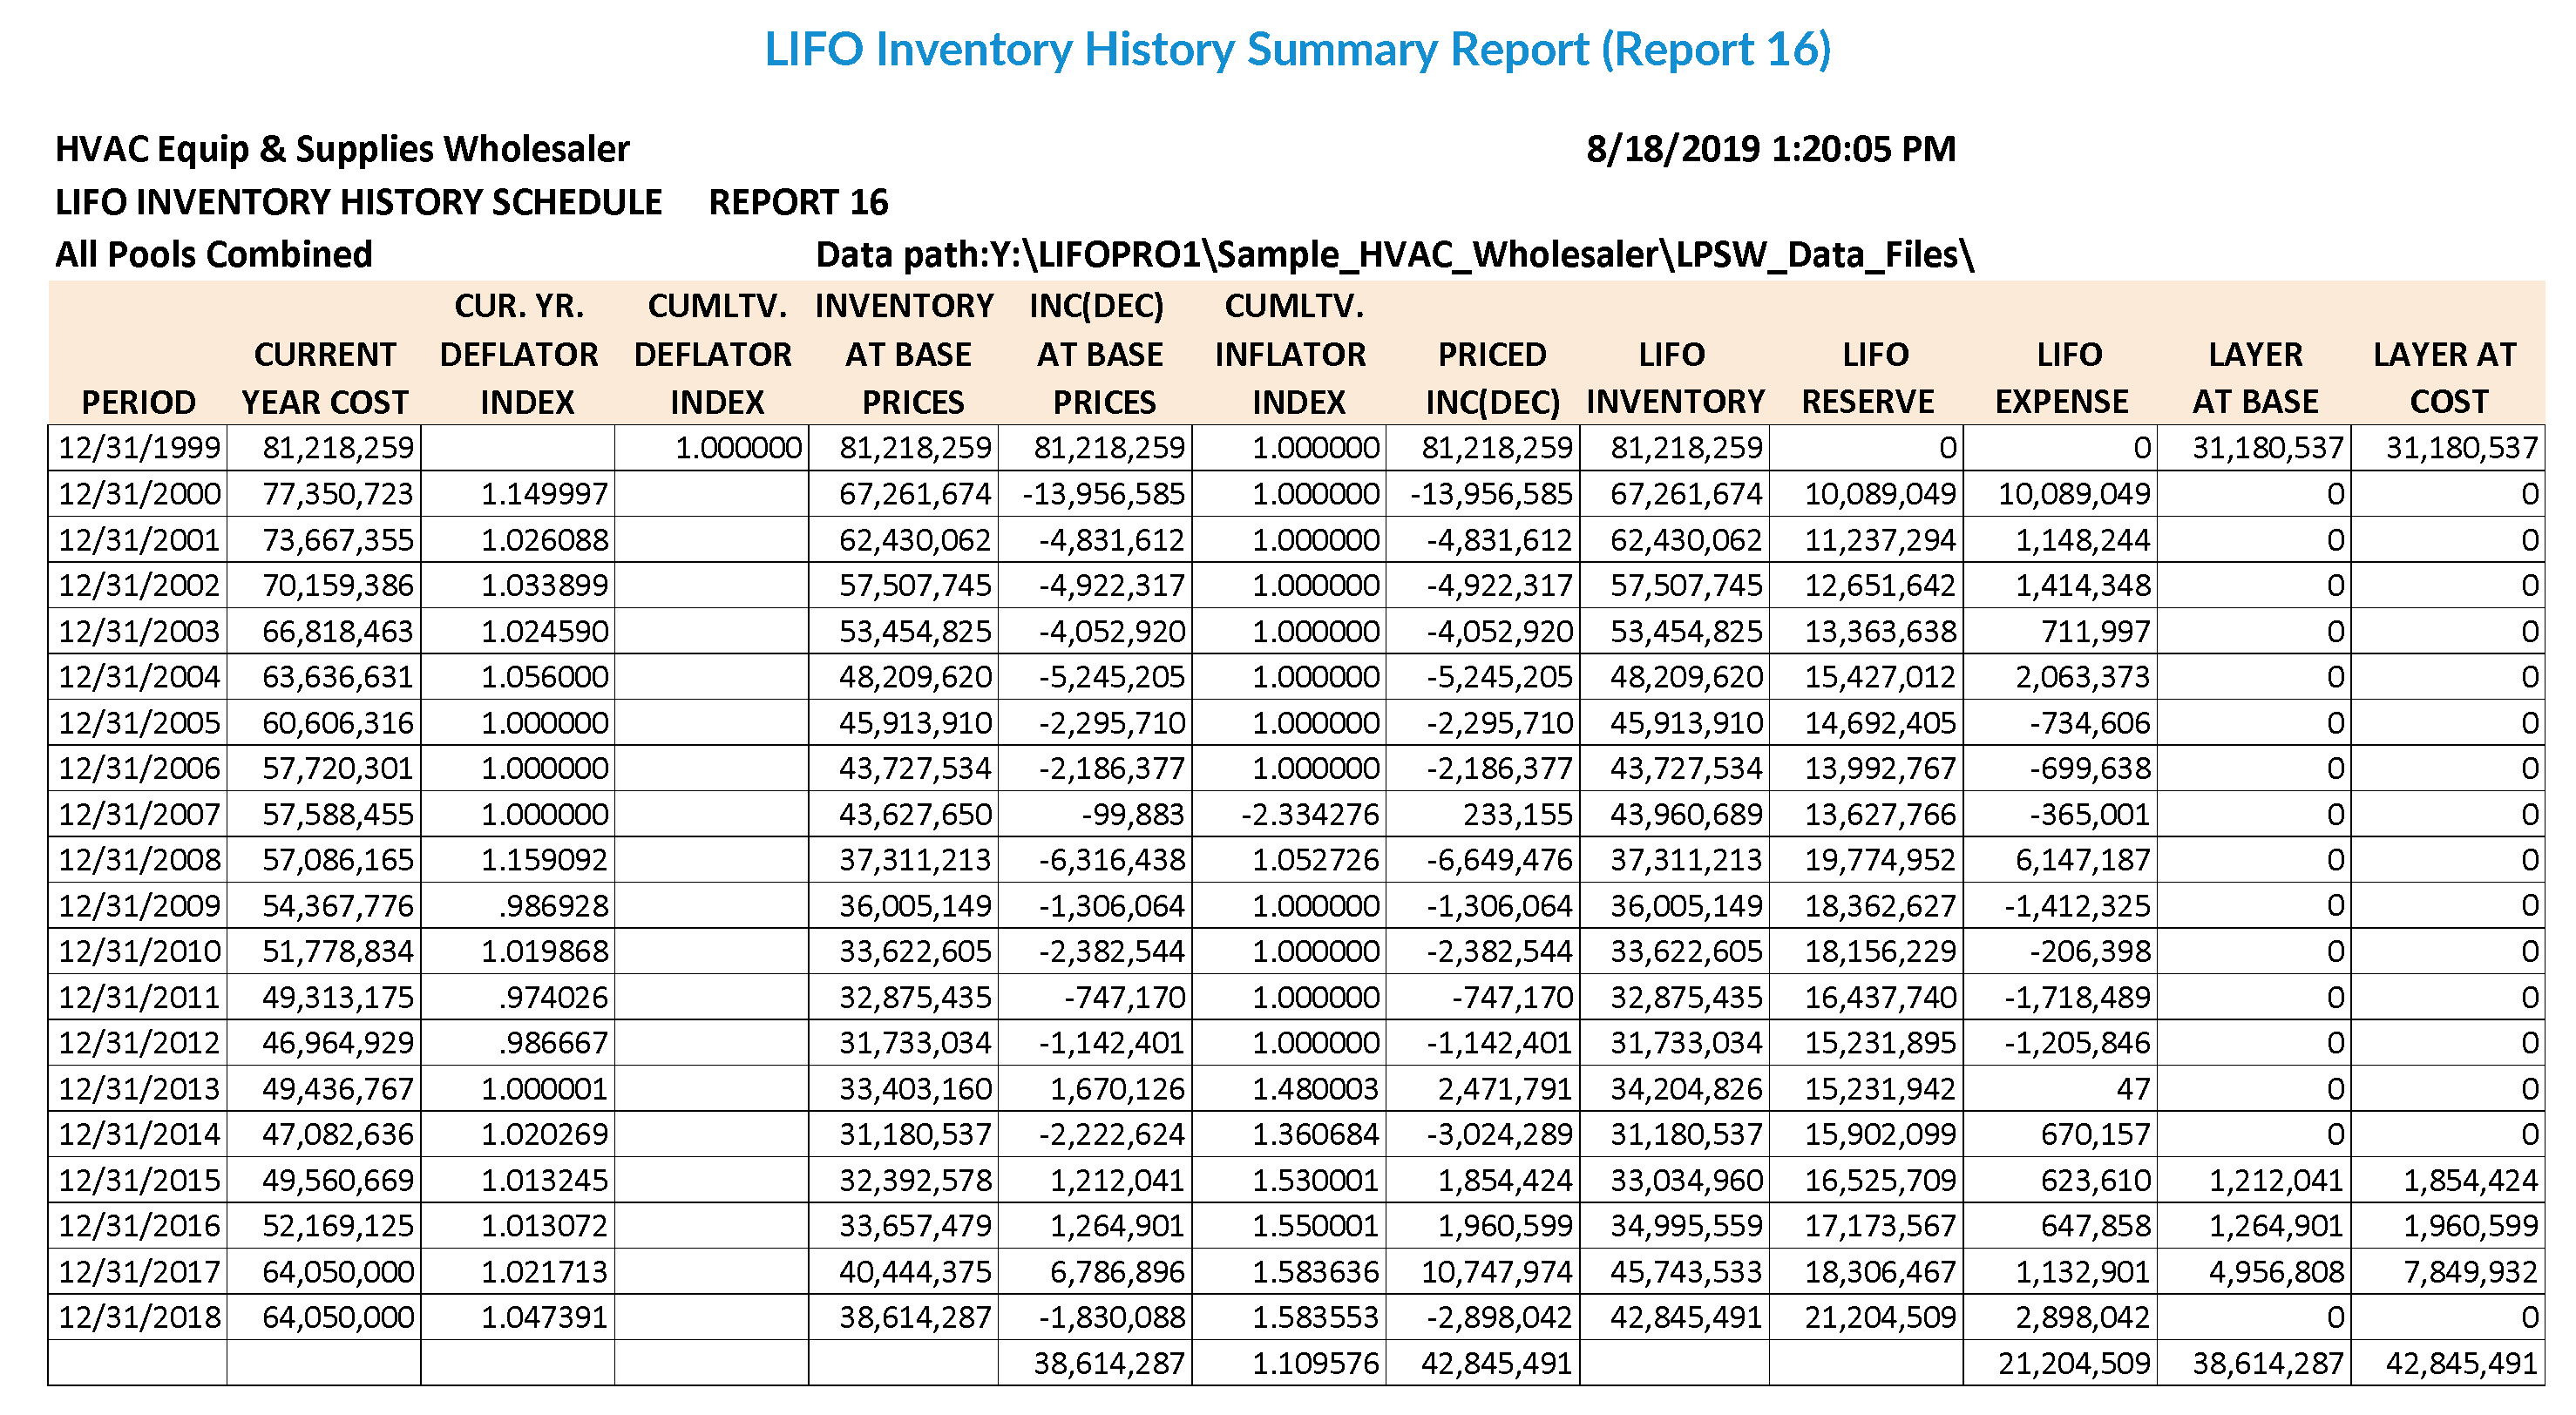
LIFO Inventory History Summary Report (Report 16) – This is a one page per pool LIFO history carryforward schedule for all years, which includes all data fields involved in the calculation of LIFO balances once the current year index and current year cost (FIFO or average cost) total by pool has been determined. This format shows the amount of the original increment or decrement and the amount of all layers remaining as of the latest year closed. The cumulative inflator indexes for years in which there are decrements is the weighted average index of the layers eroded and is equal to the Priced Increase (Decrease) or decrease in LIFO cost divided by the decrease at base prices. The detail of which years’ layers are eroded for decrements is shown in Reports 16a and 18a.
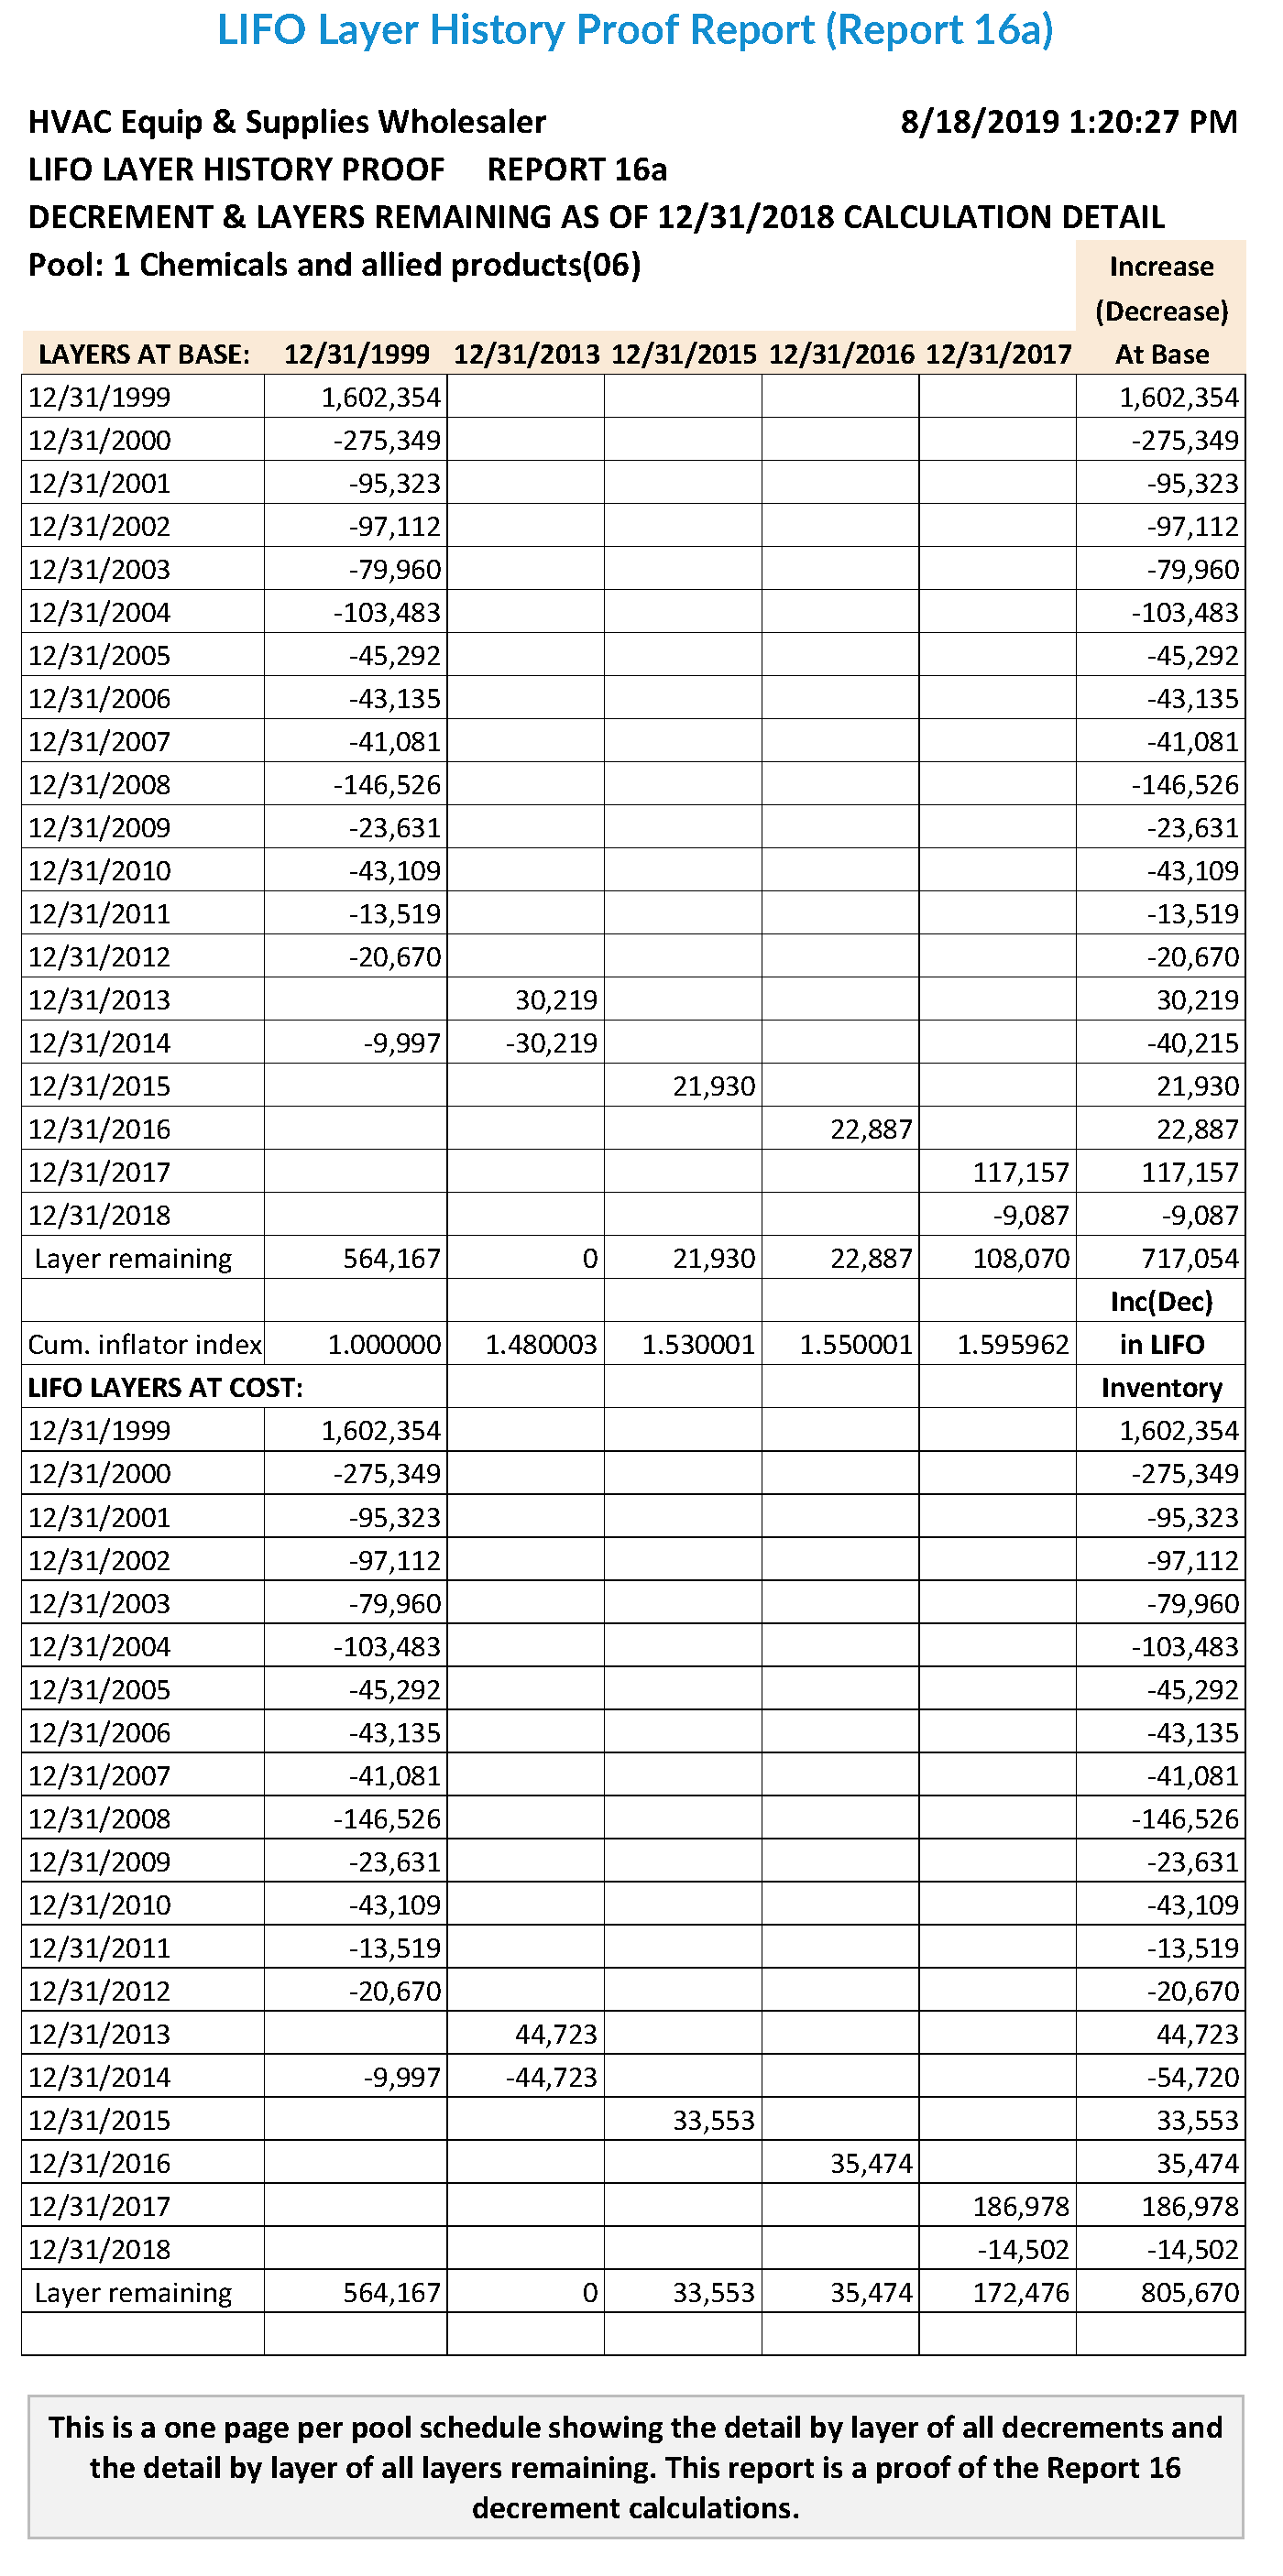
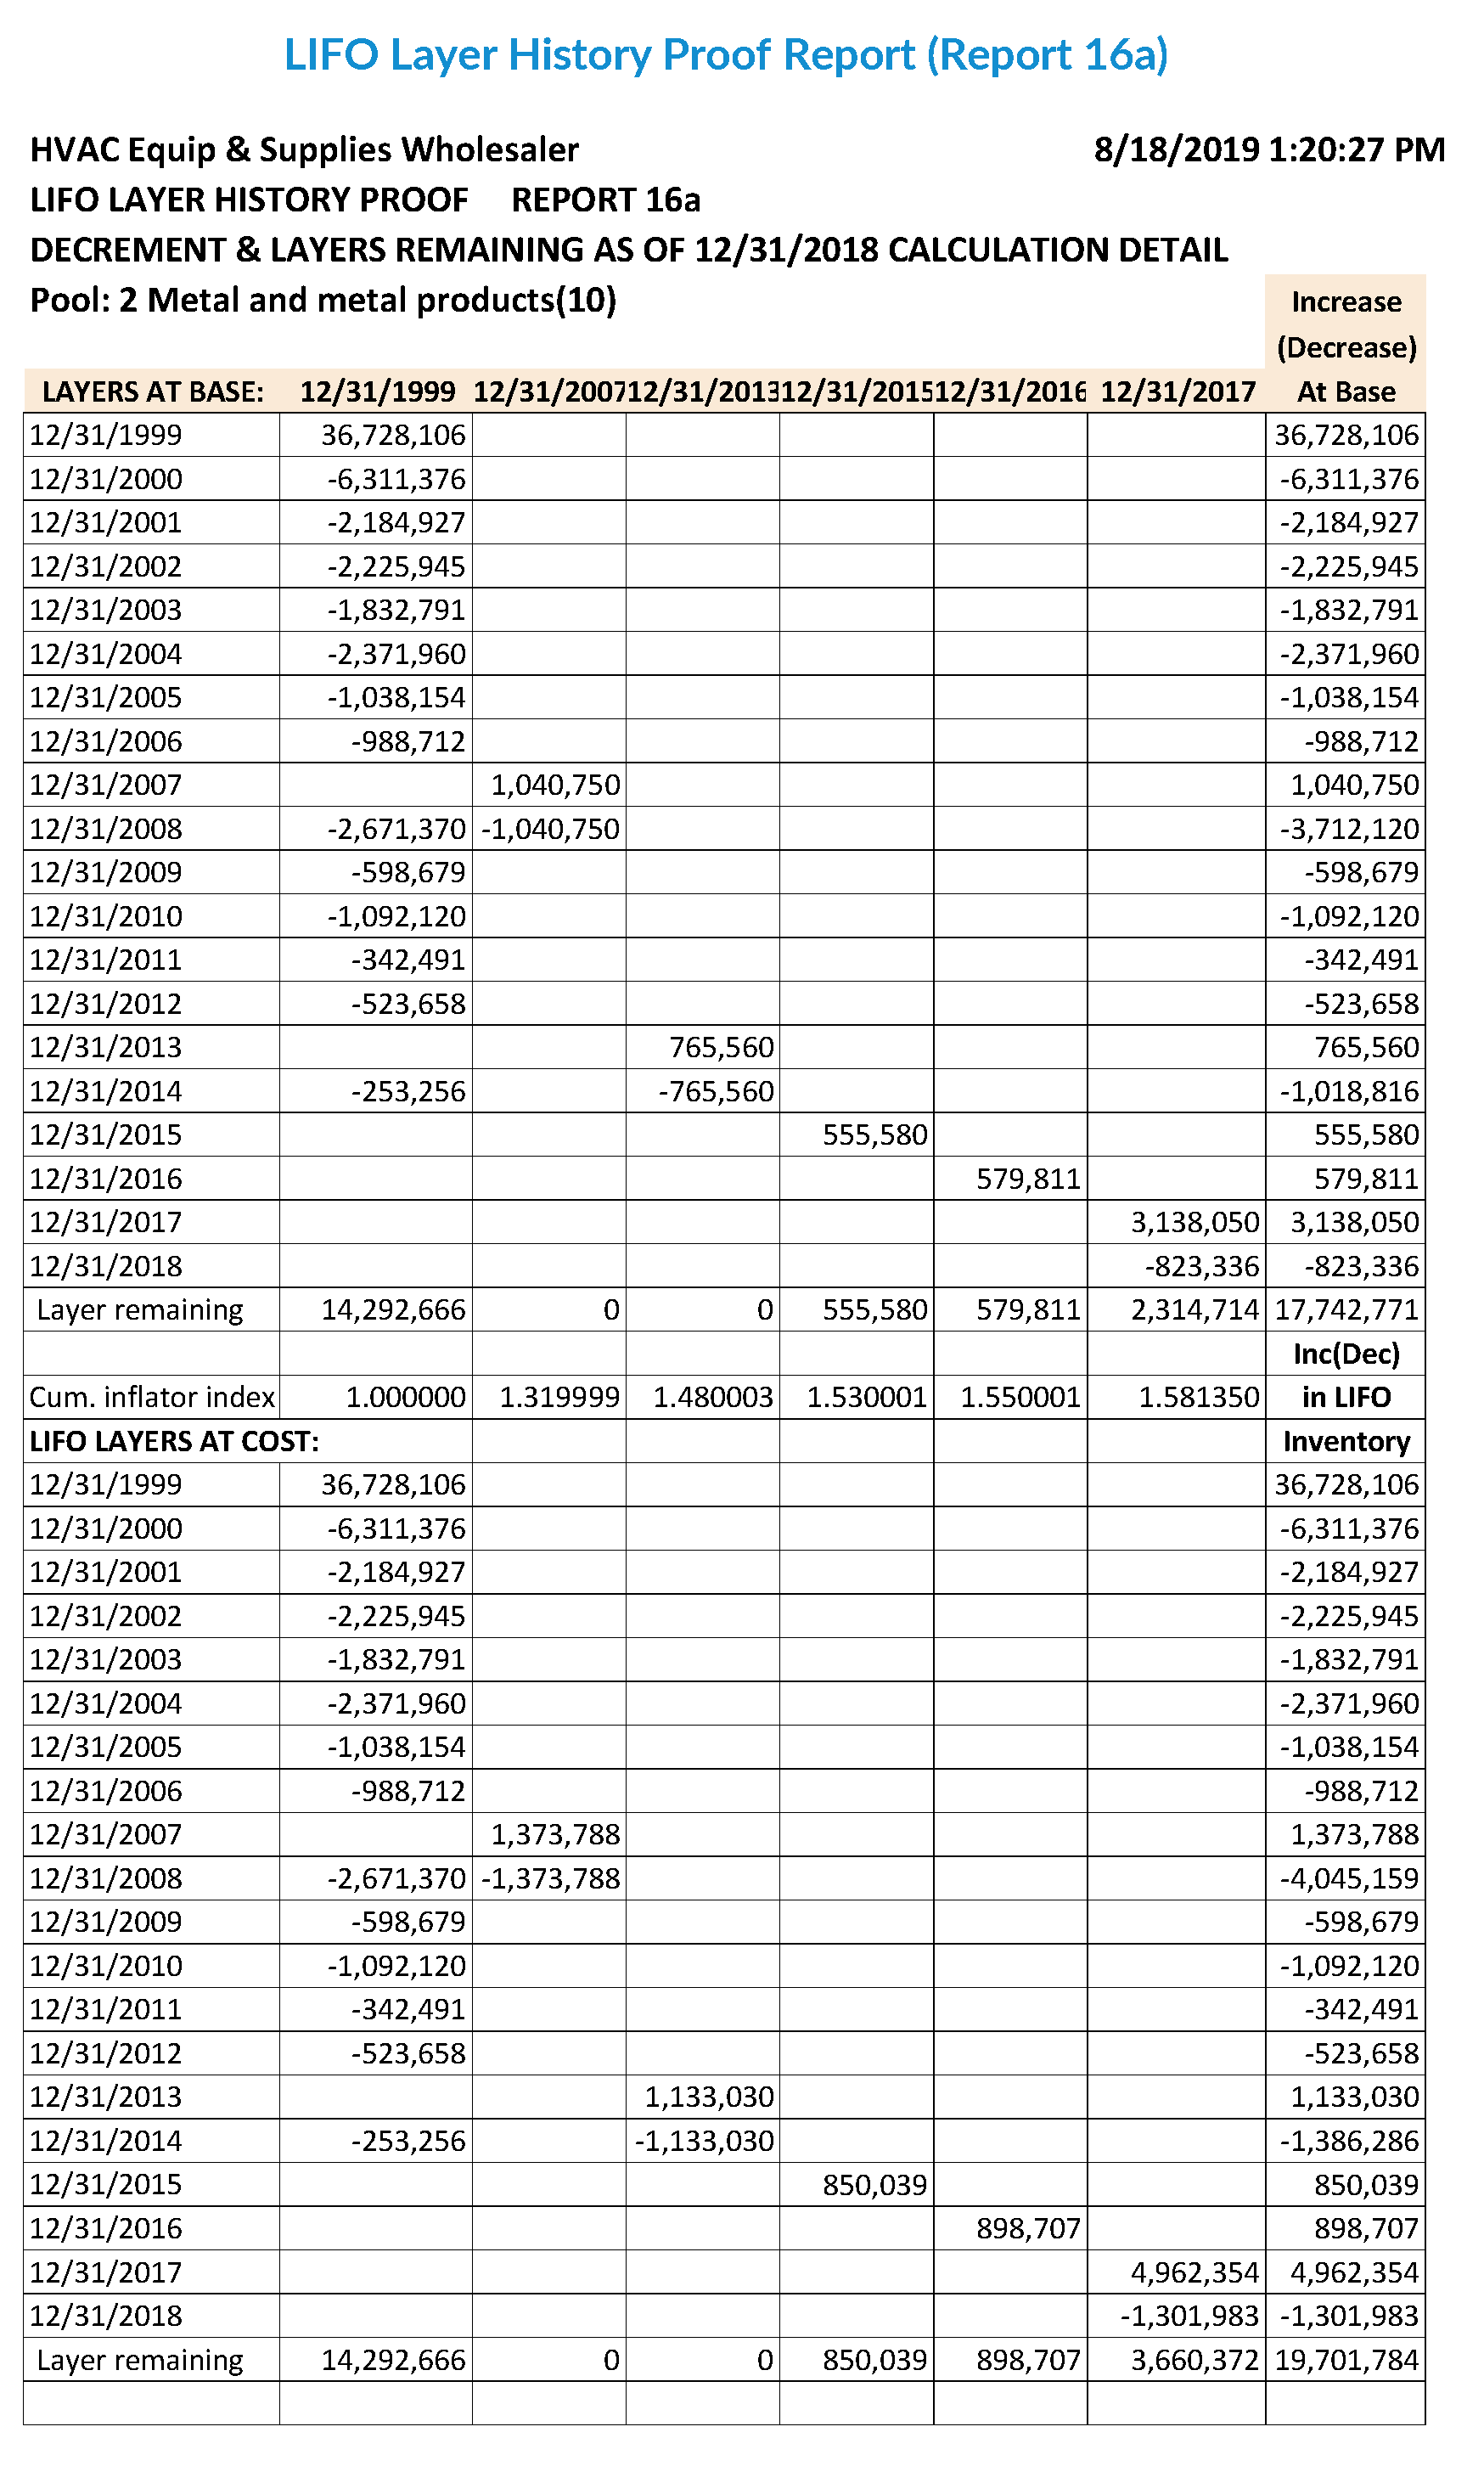
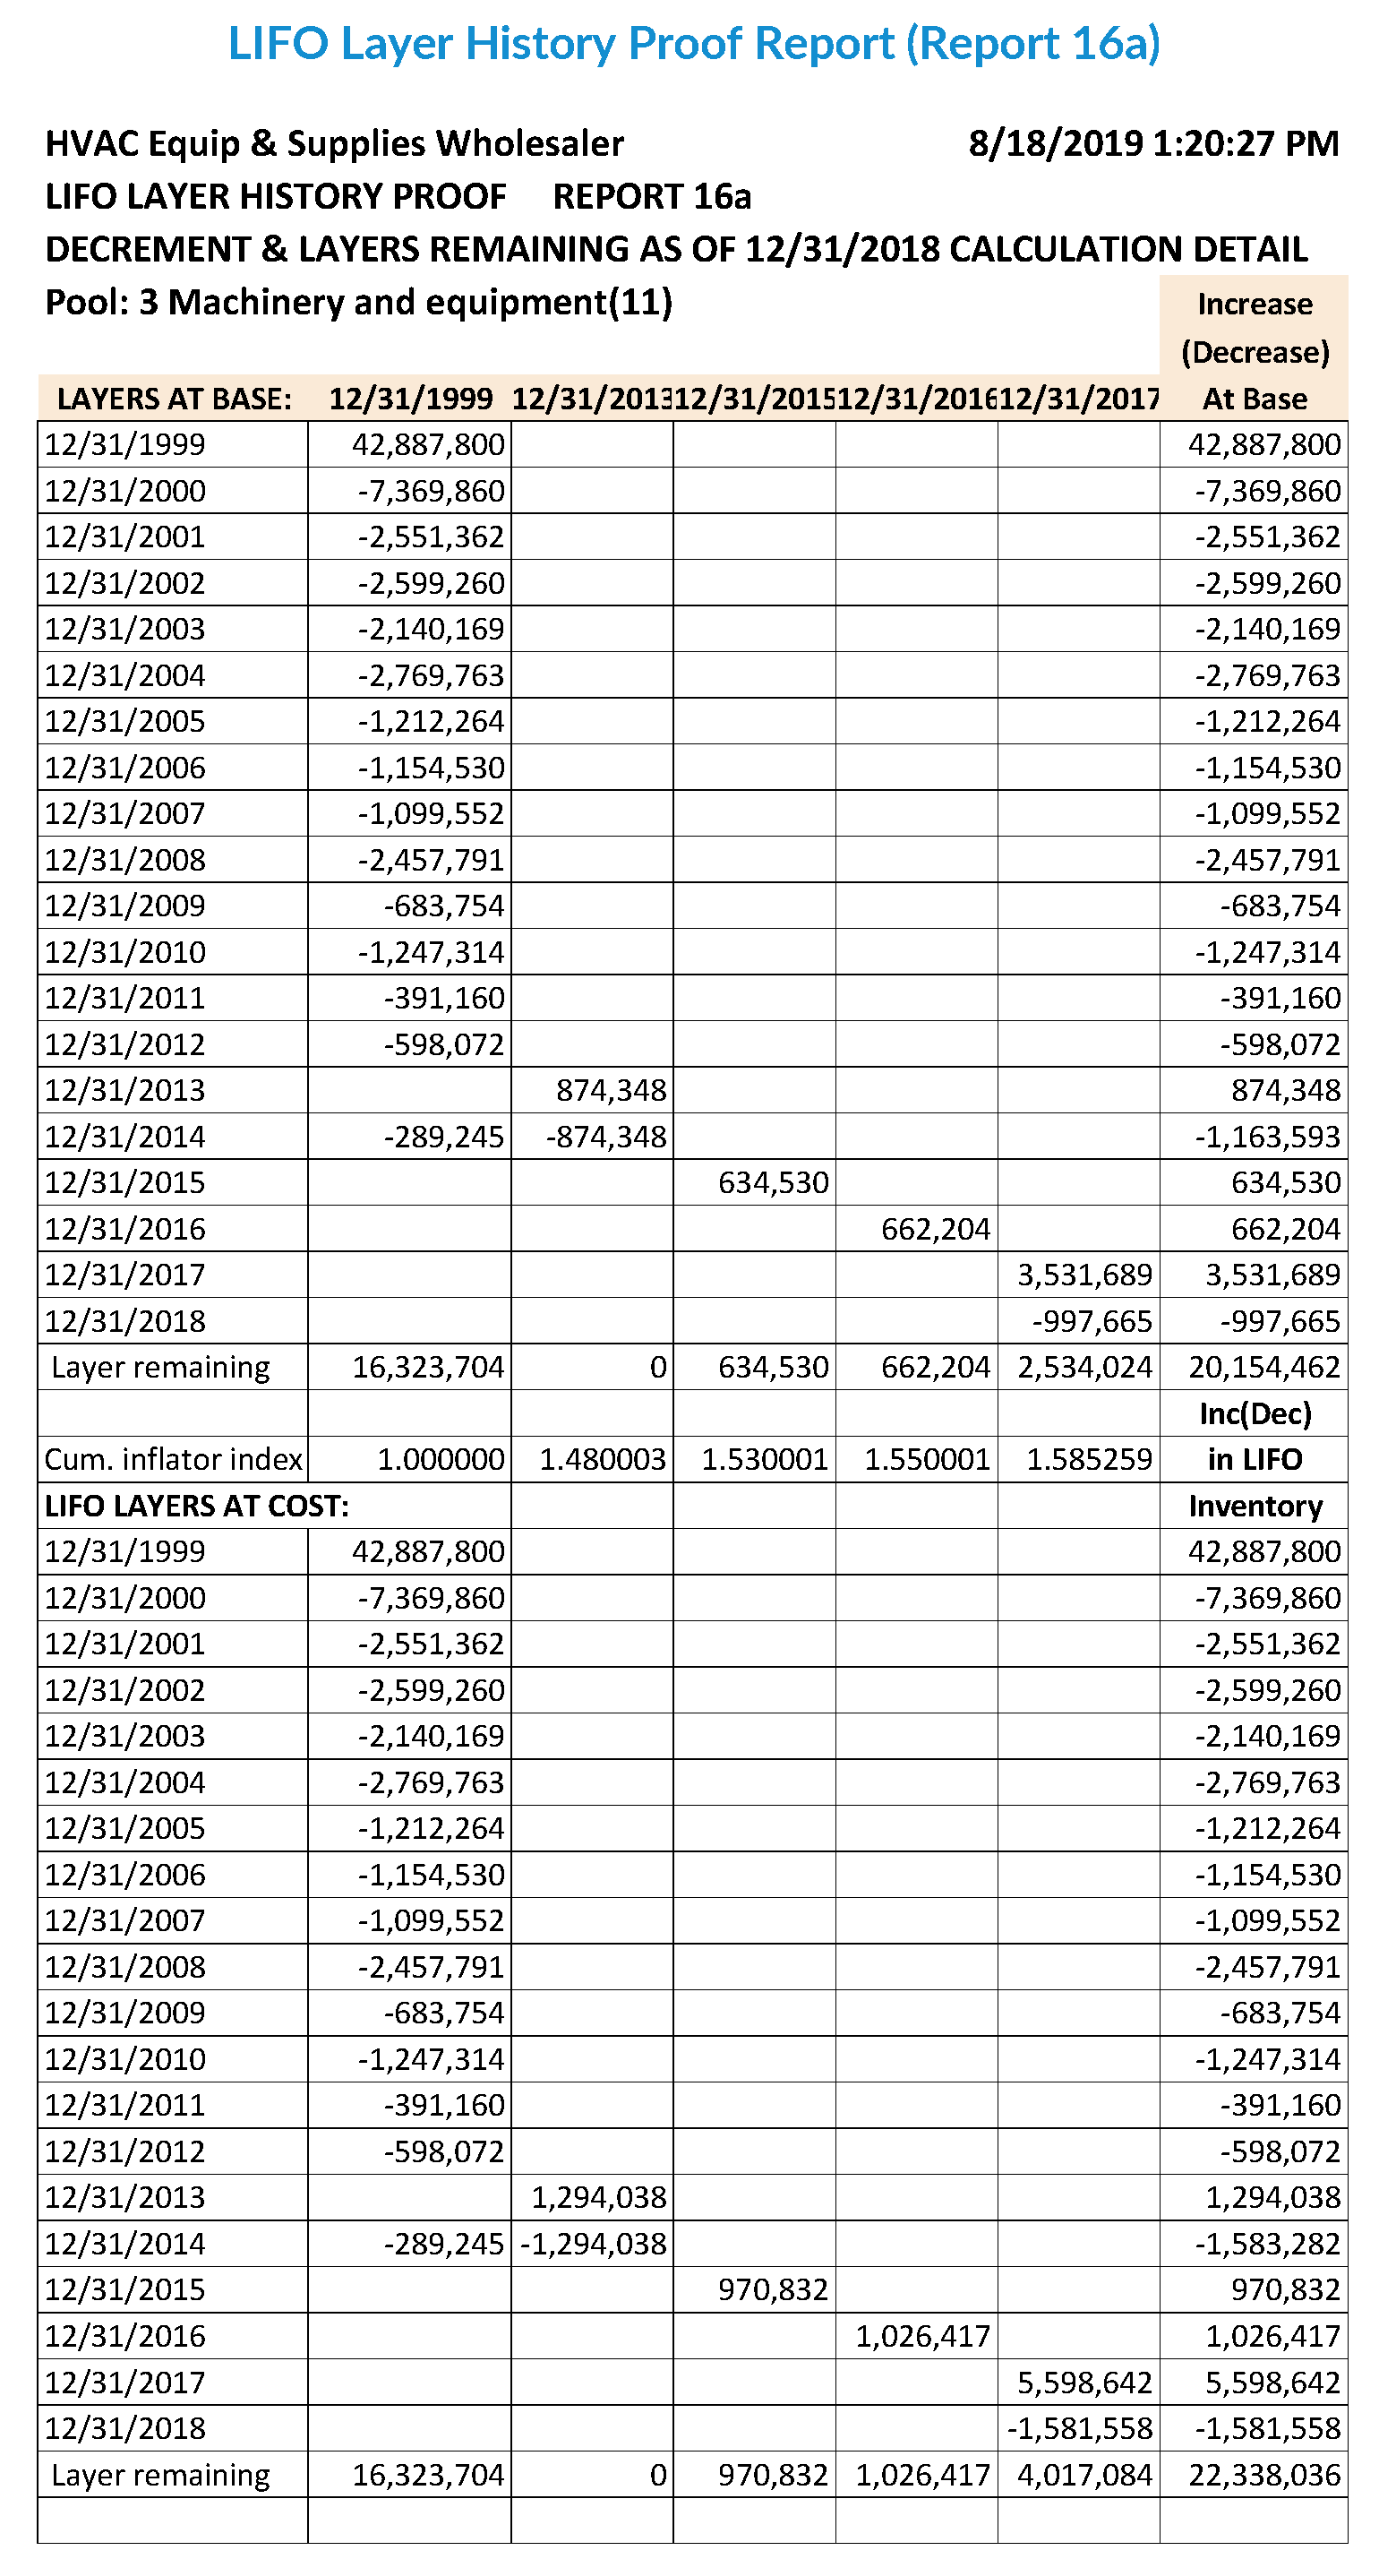
LIFO Layer History Proof Report (Report 16a) – This is a one page per pool schedule showing the detail by layer of all decrements and the detail by layer of all layers remaining. This report is a proof of the Report 16 decrement calculations.
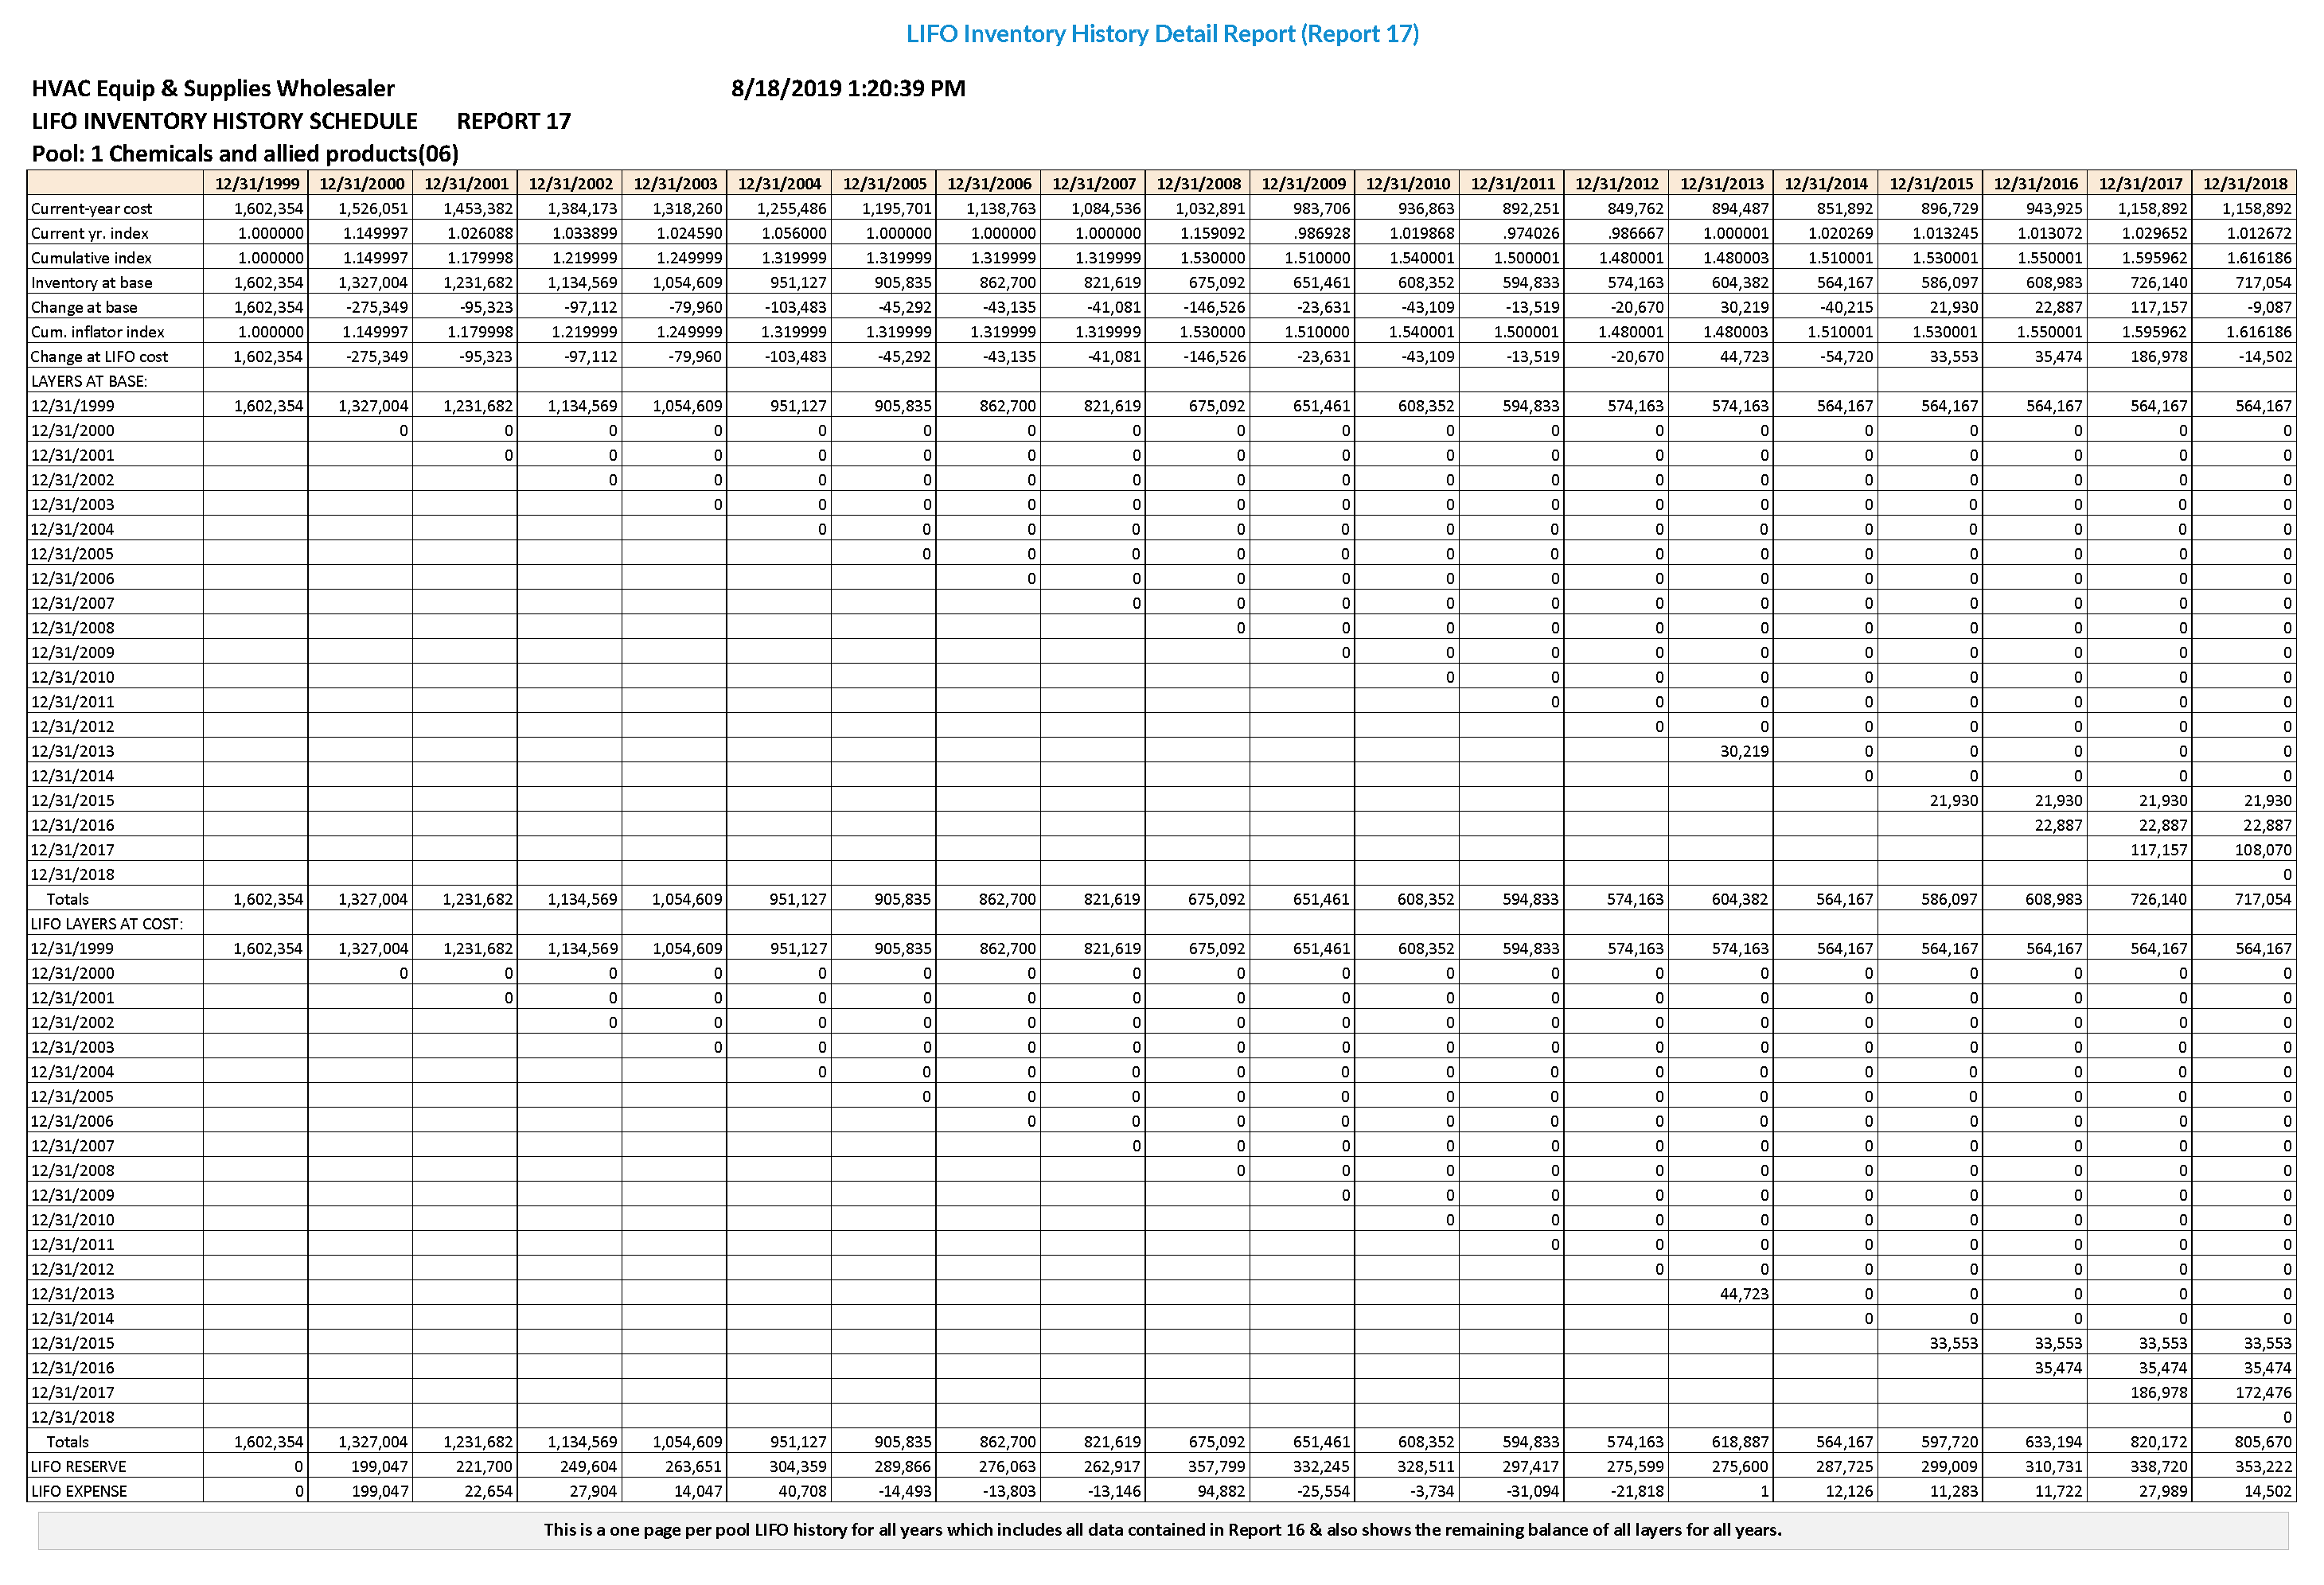
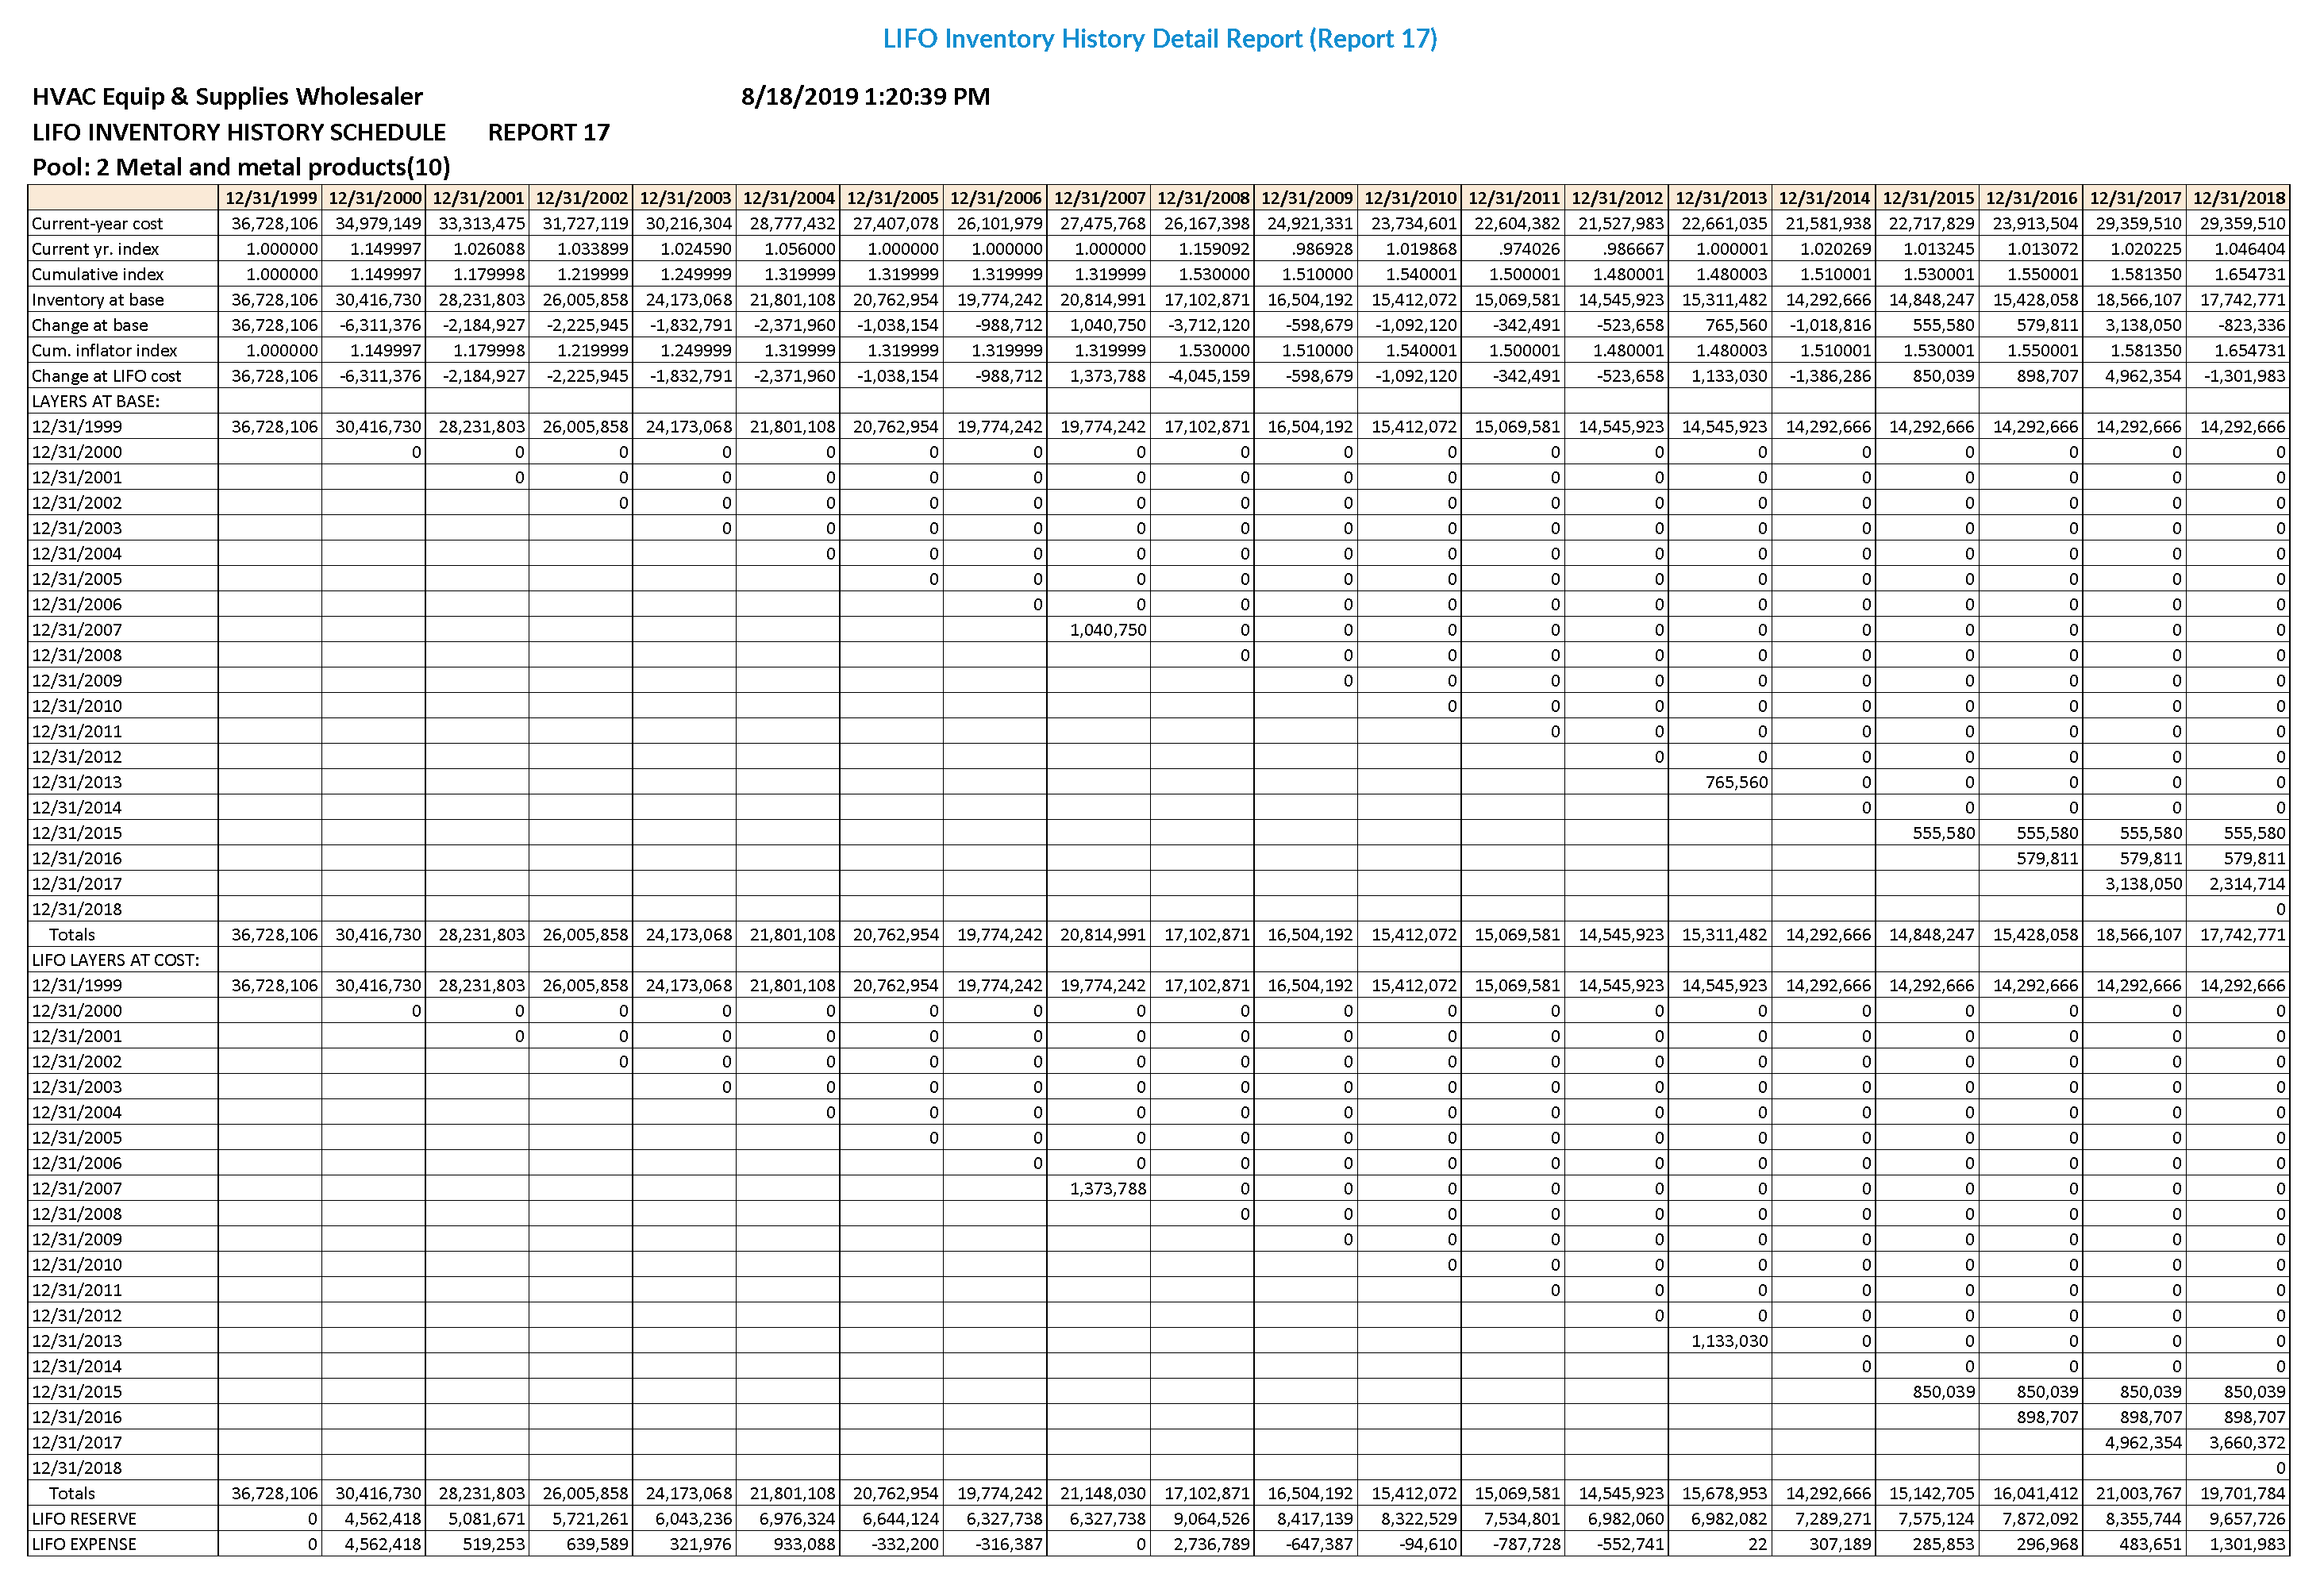
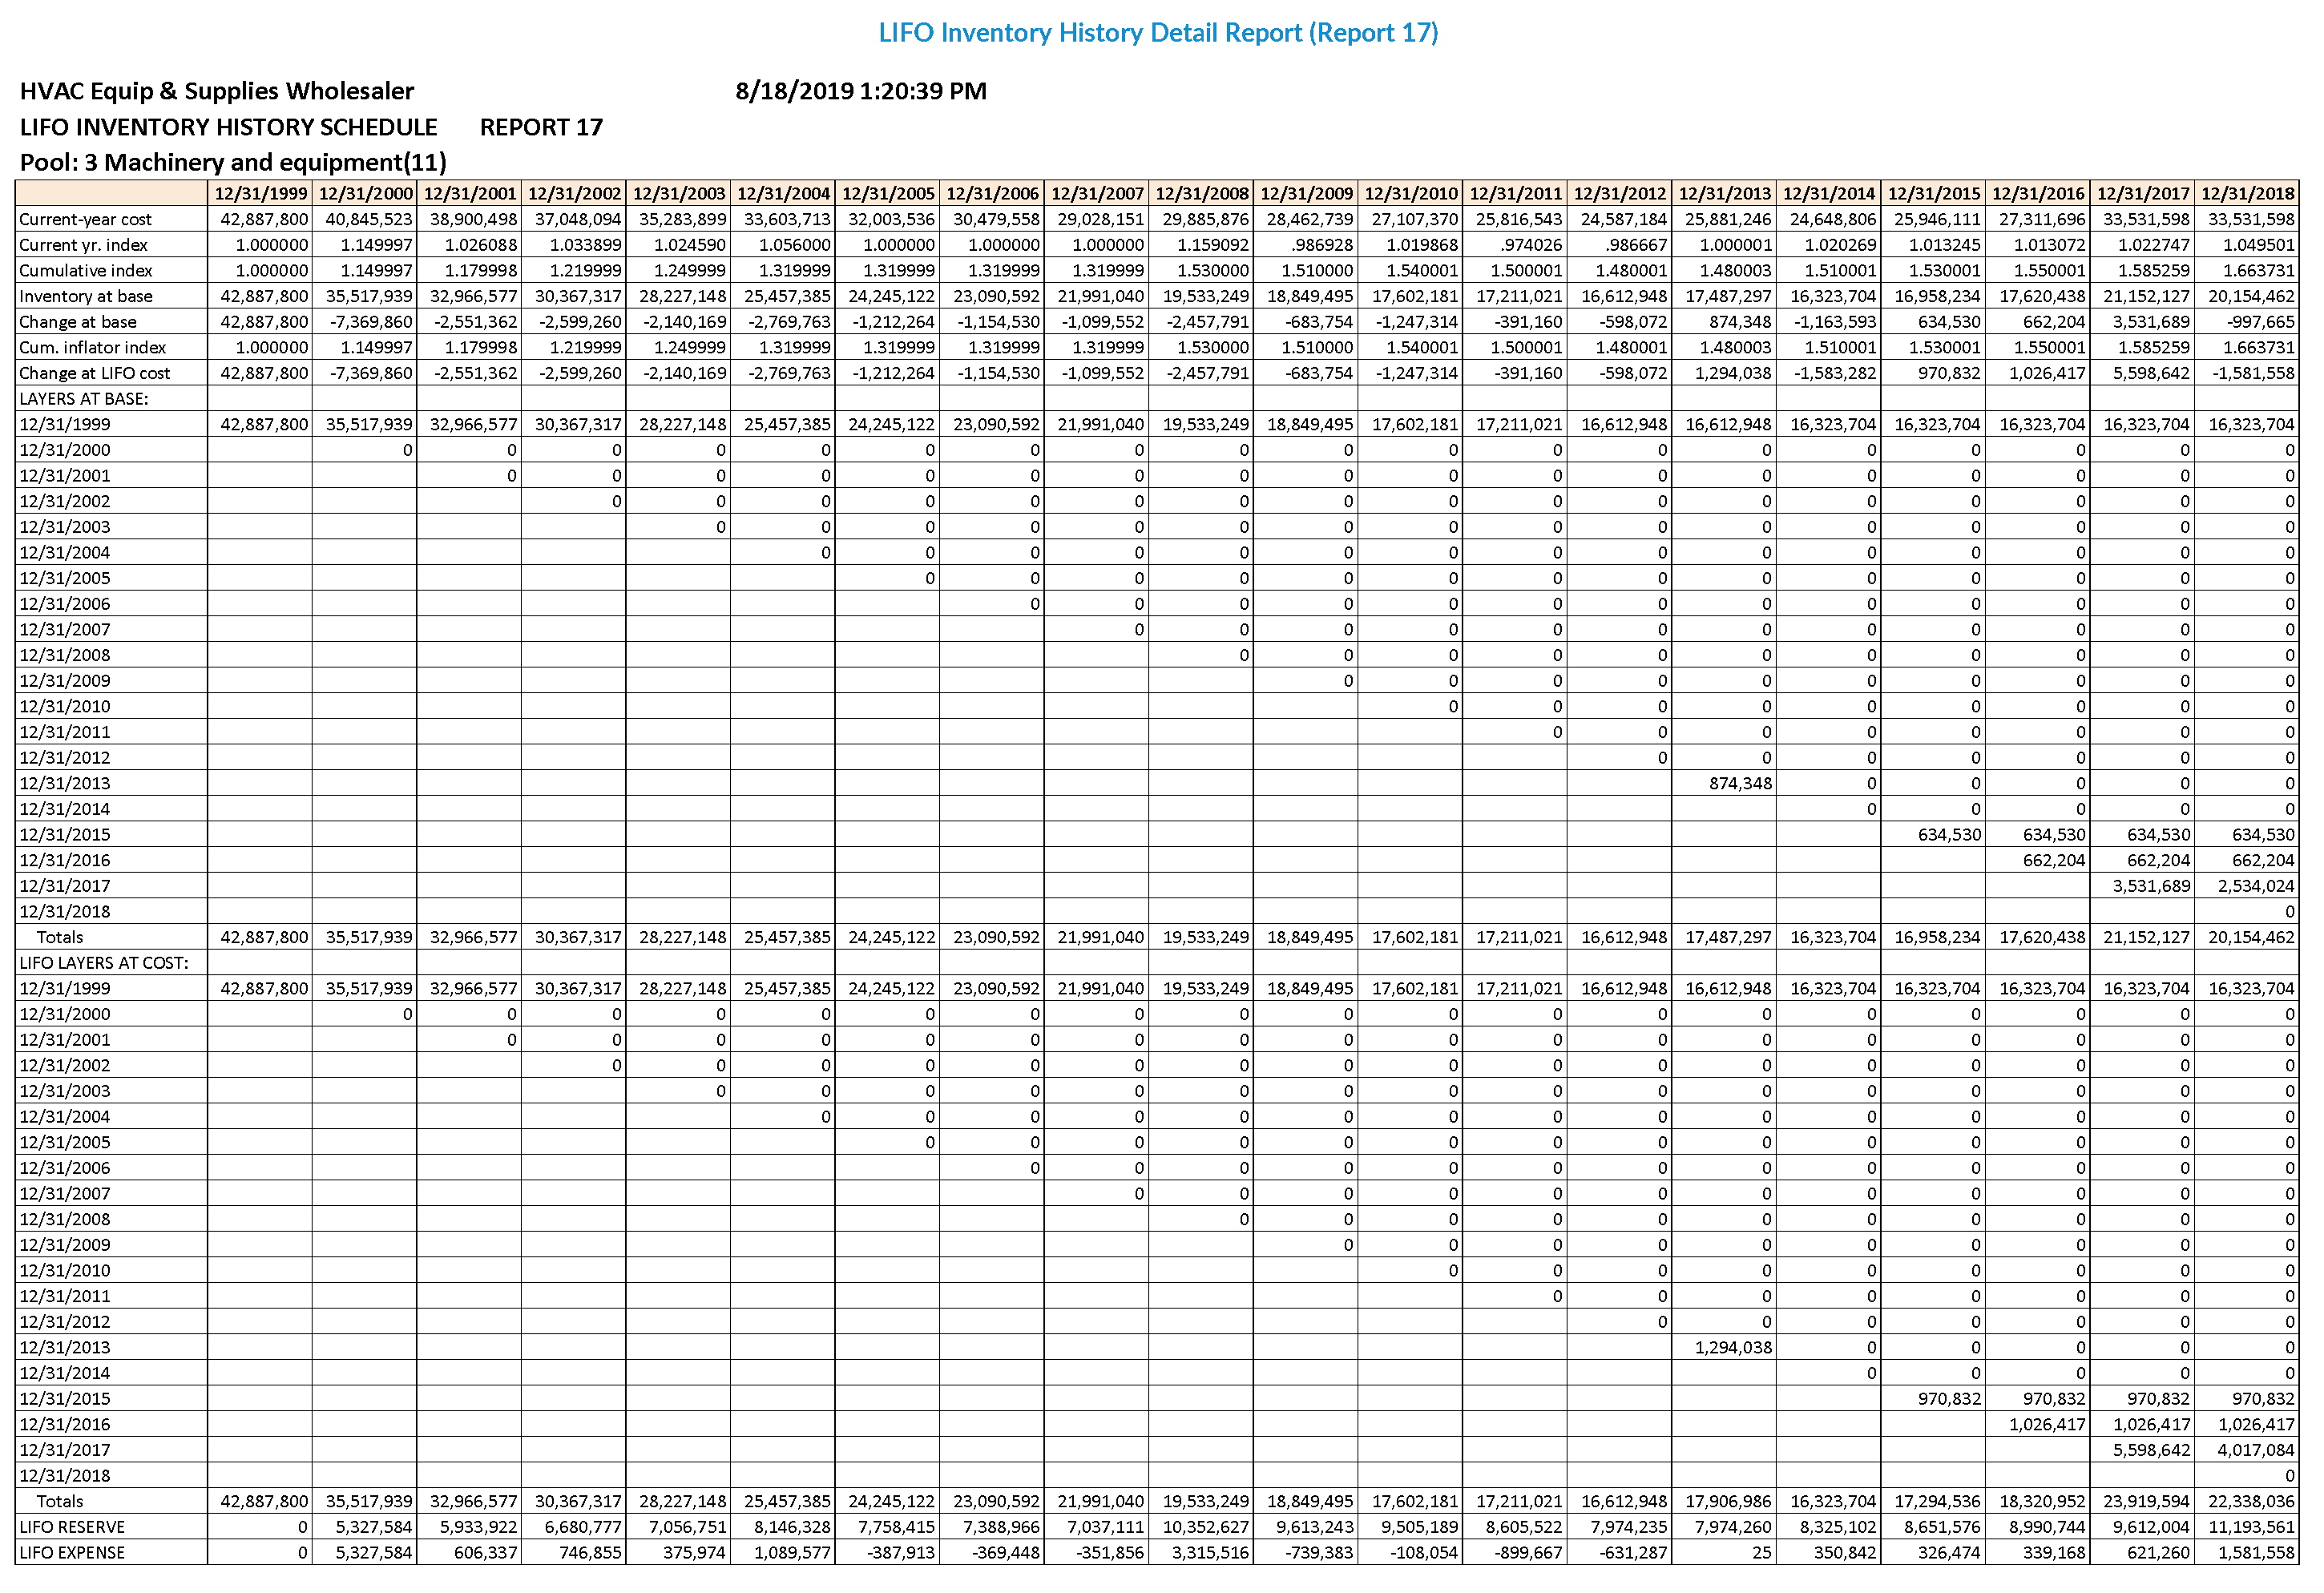
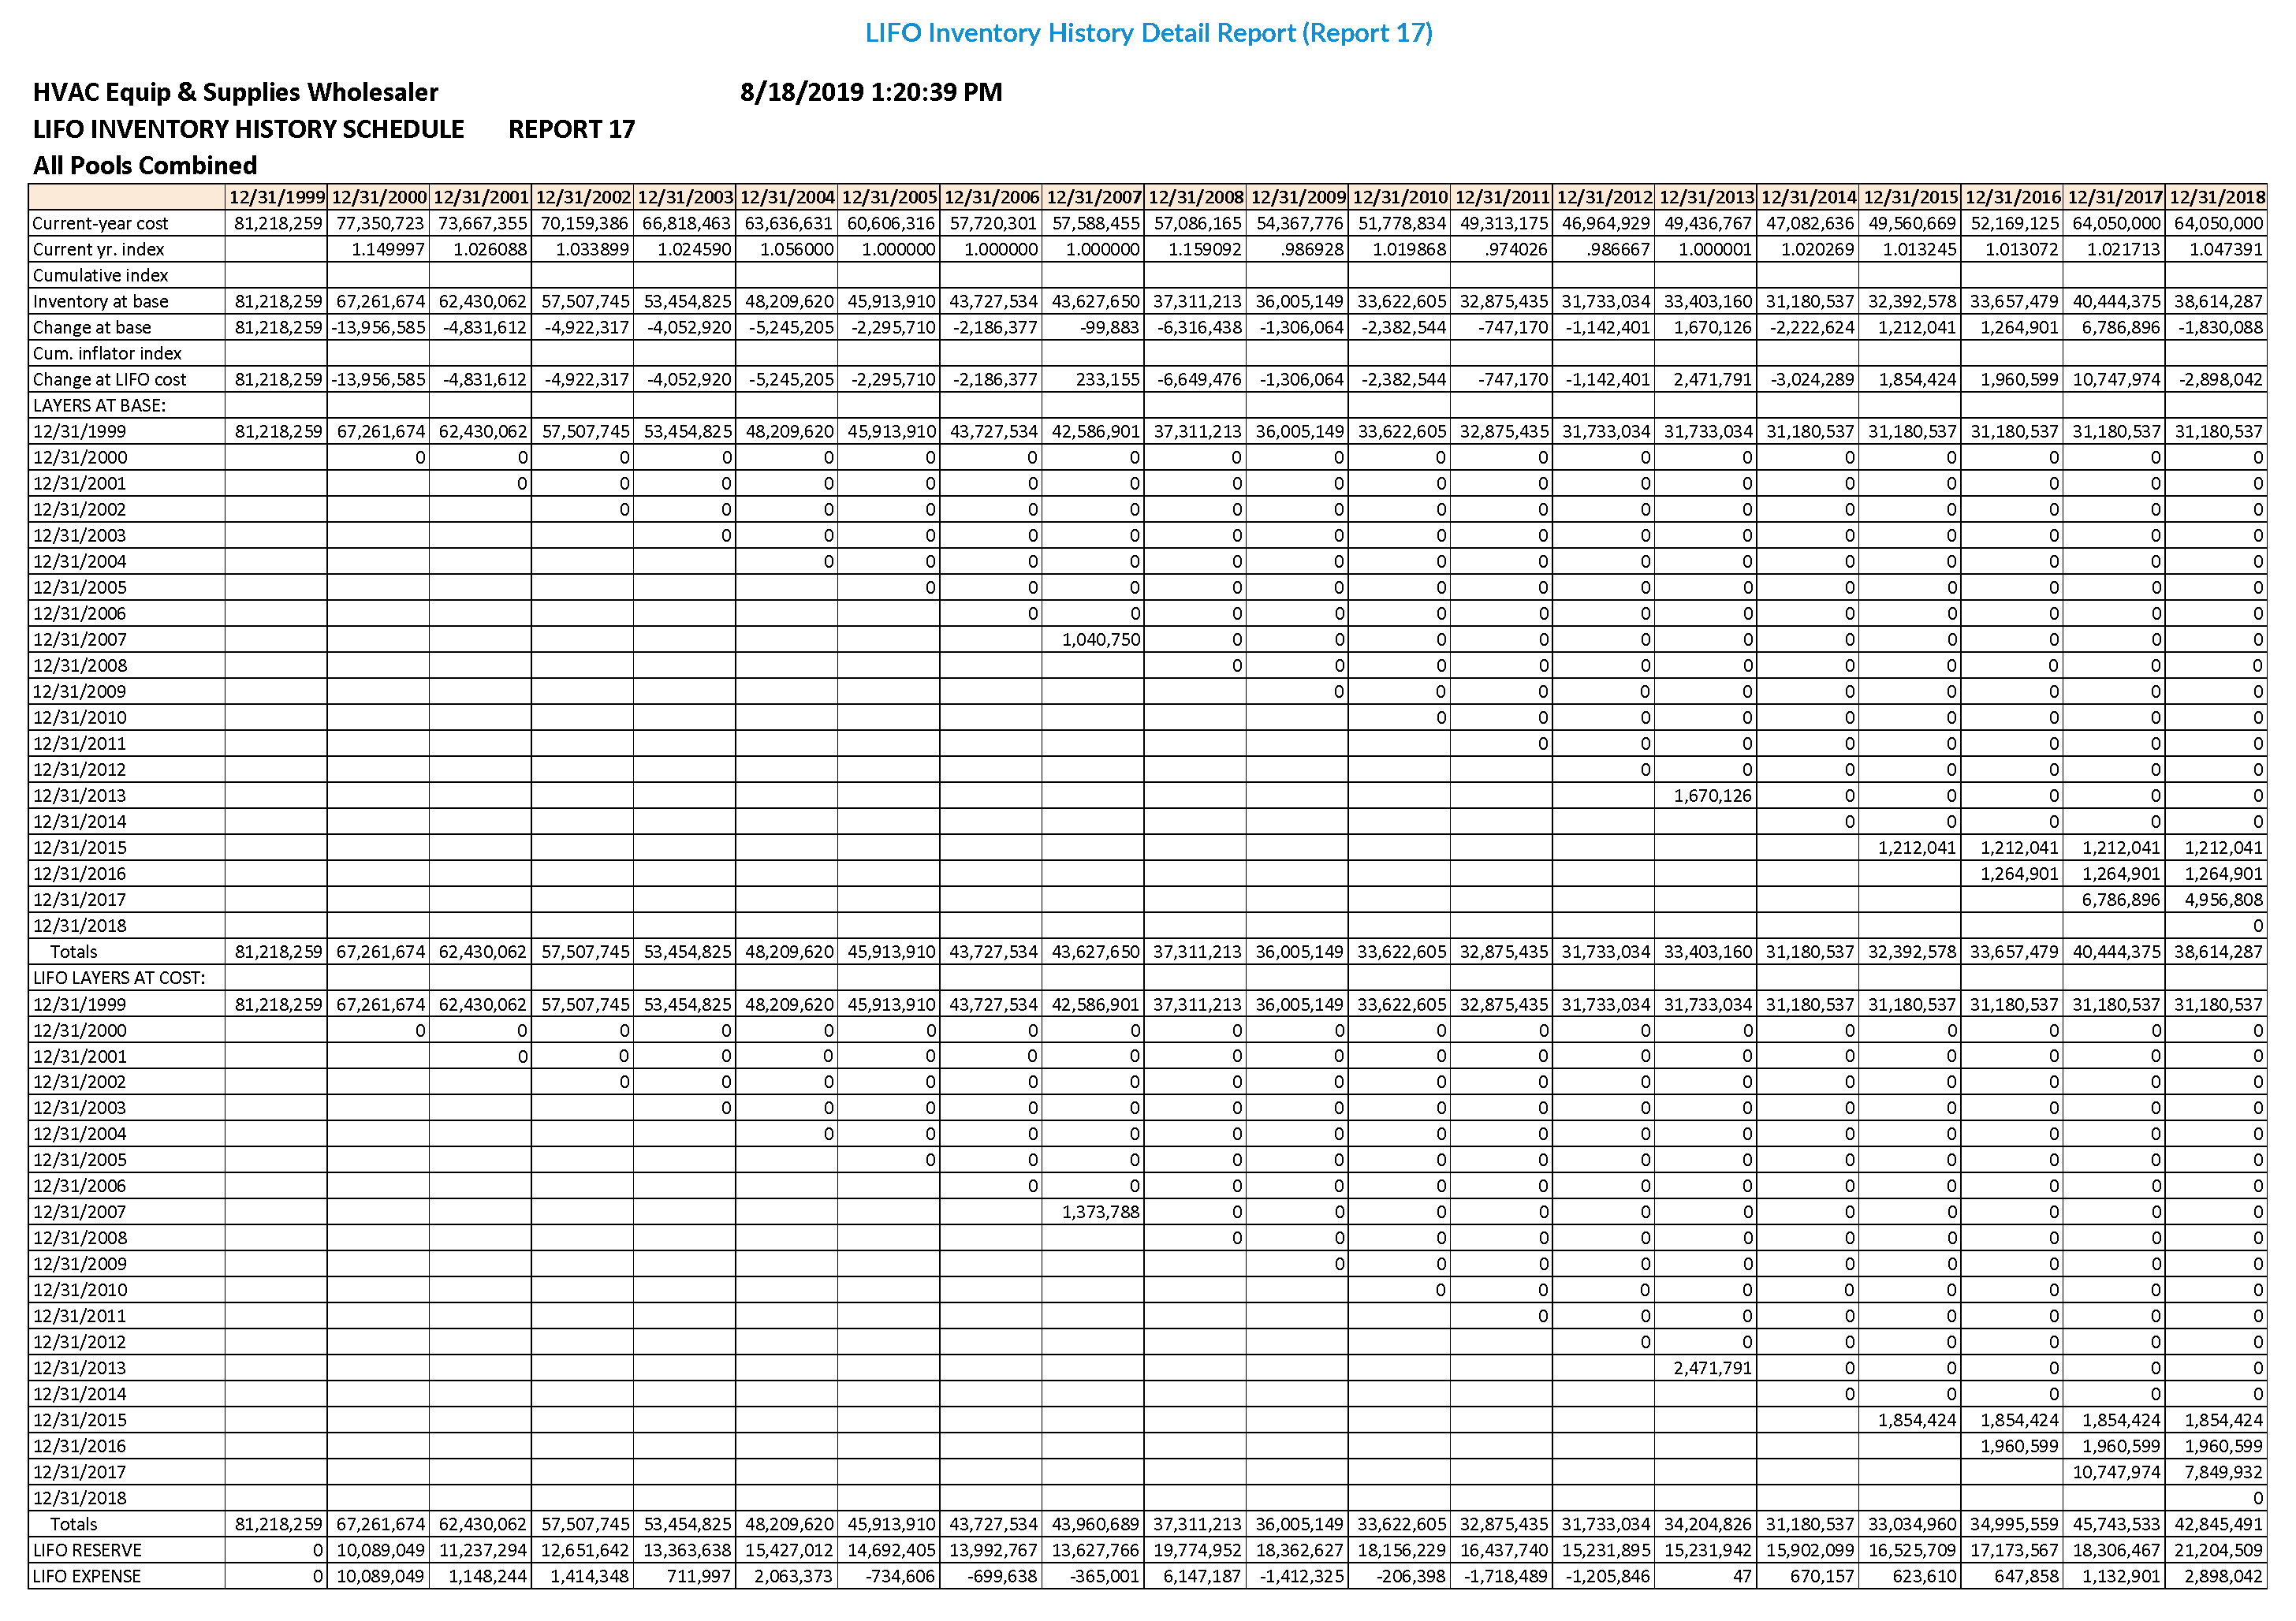
LIFO Inventory History Detail Report (Report 17) – This is a one page per pool LIFO history for all years which includes all data contained in Report 16 & also shows the remaining balance of all layers for all years.
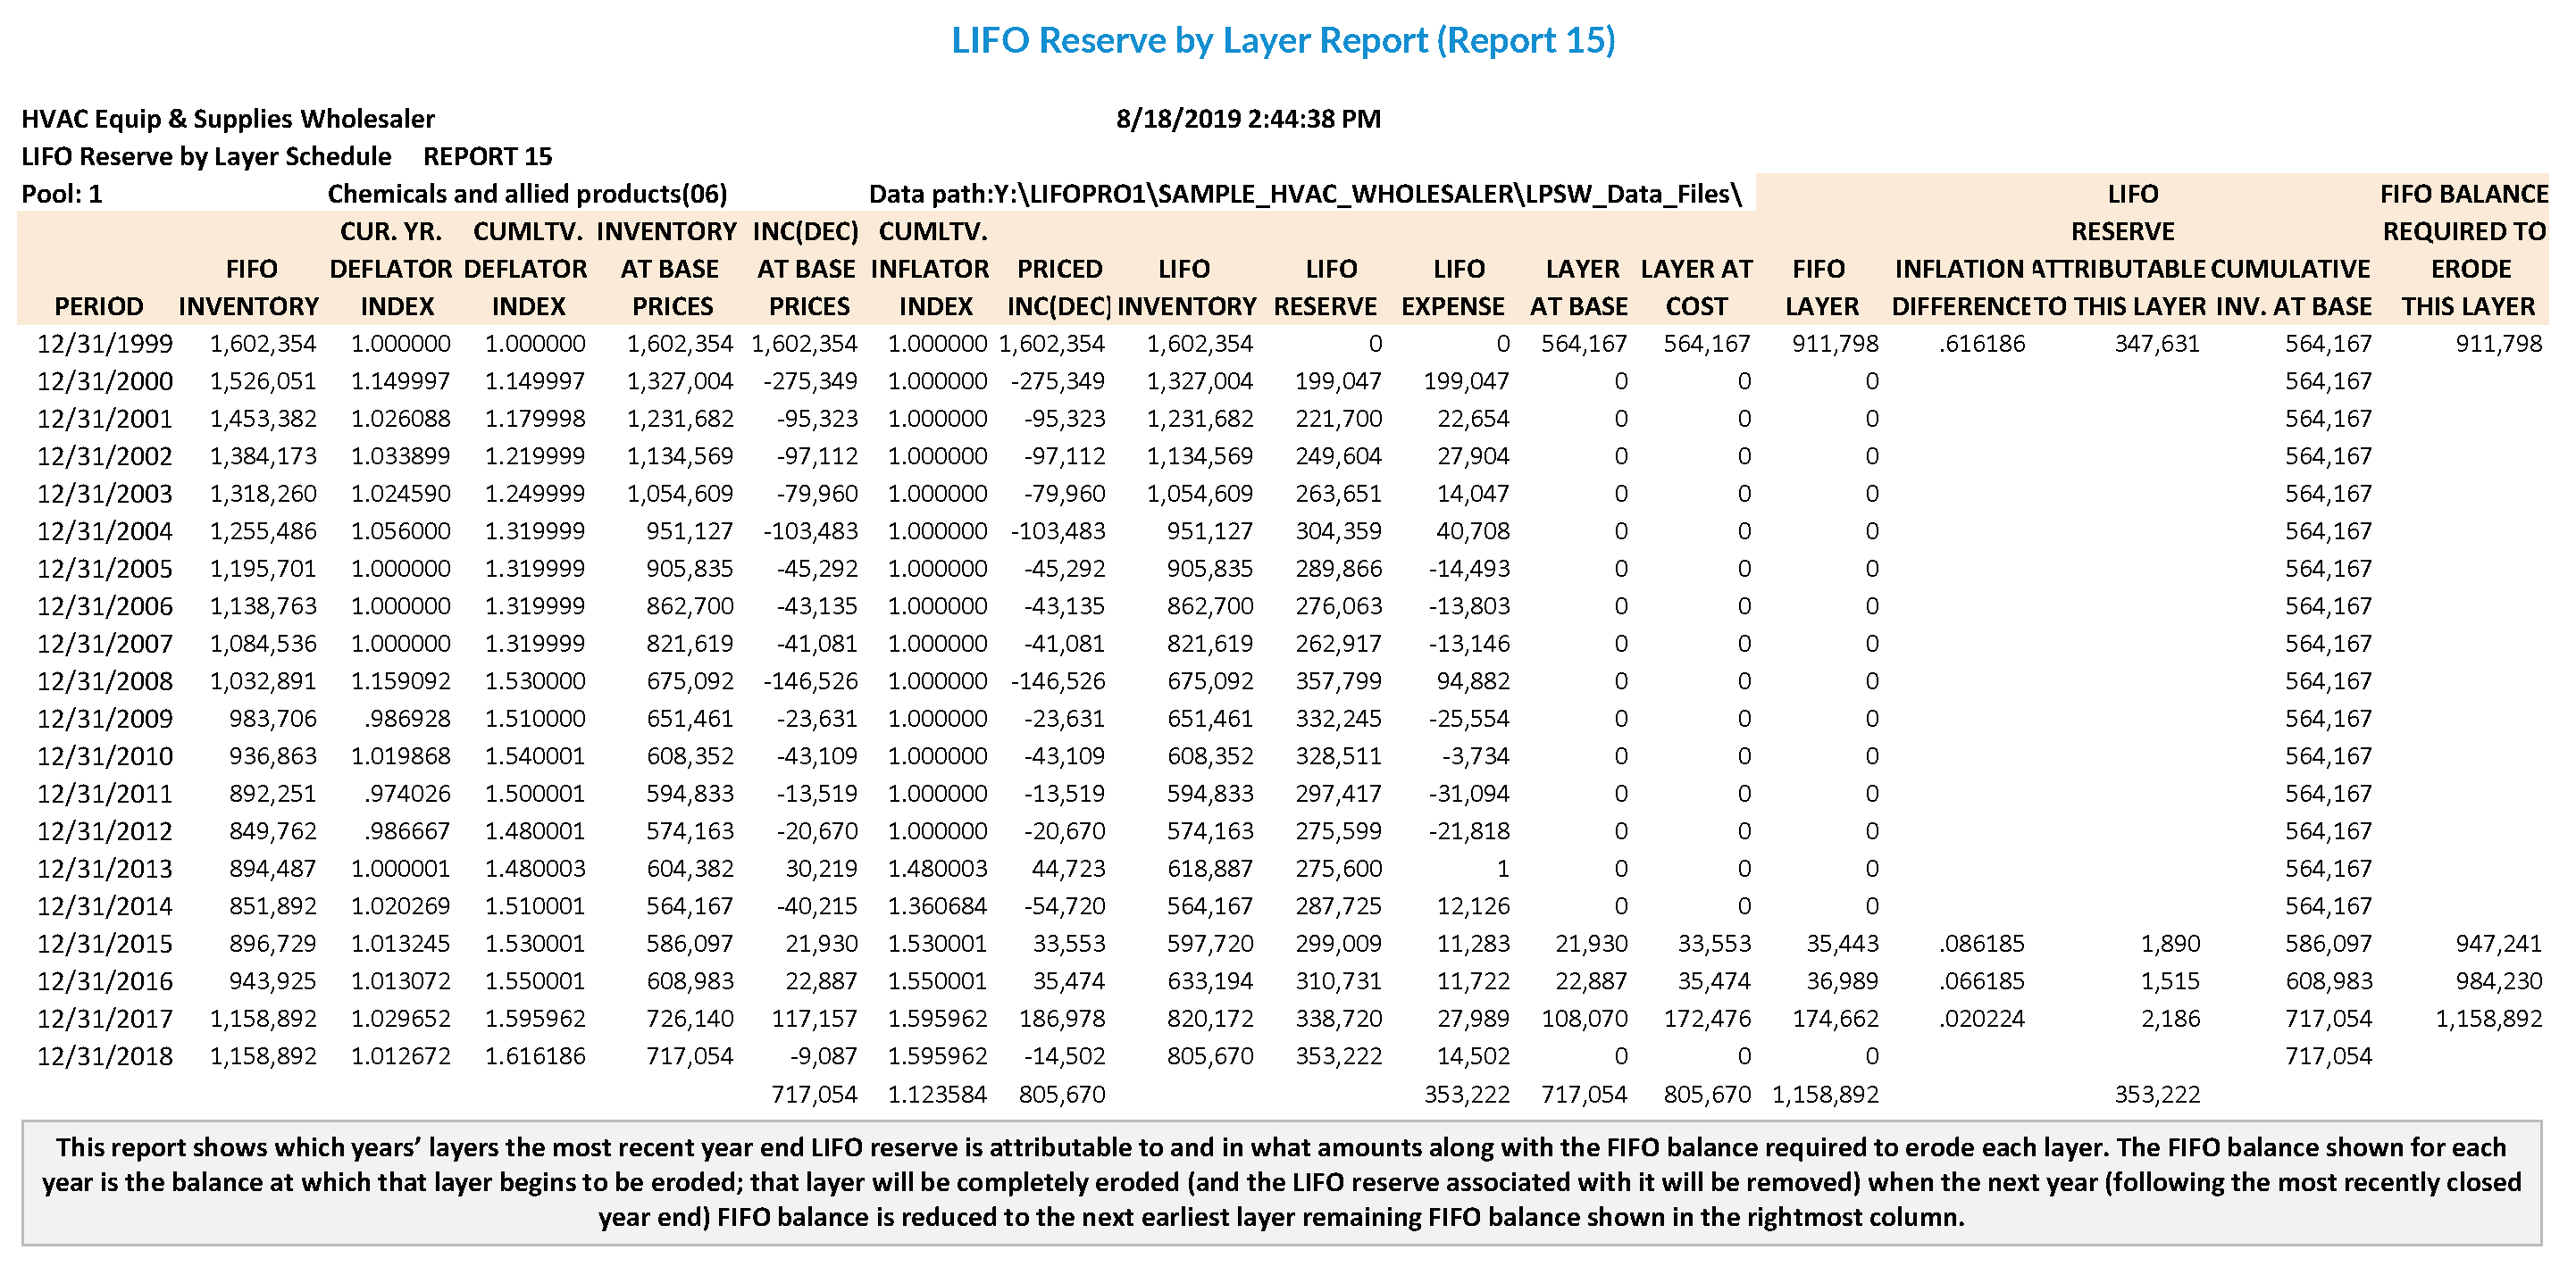
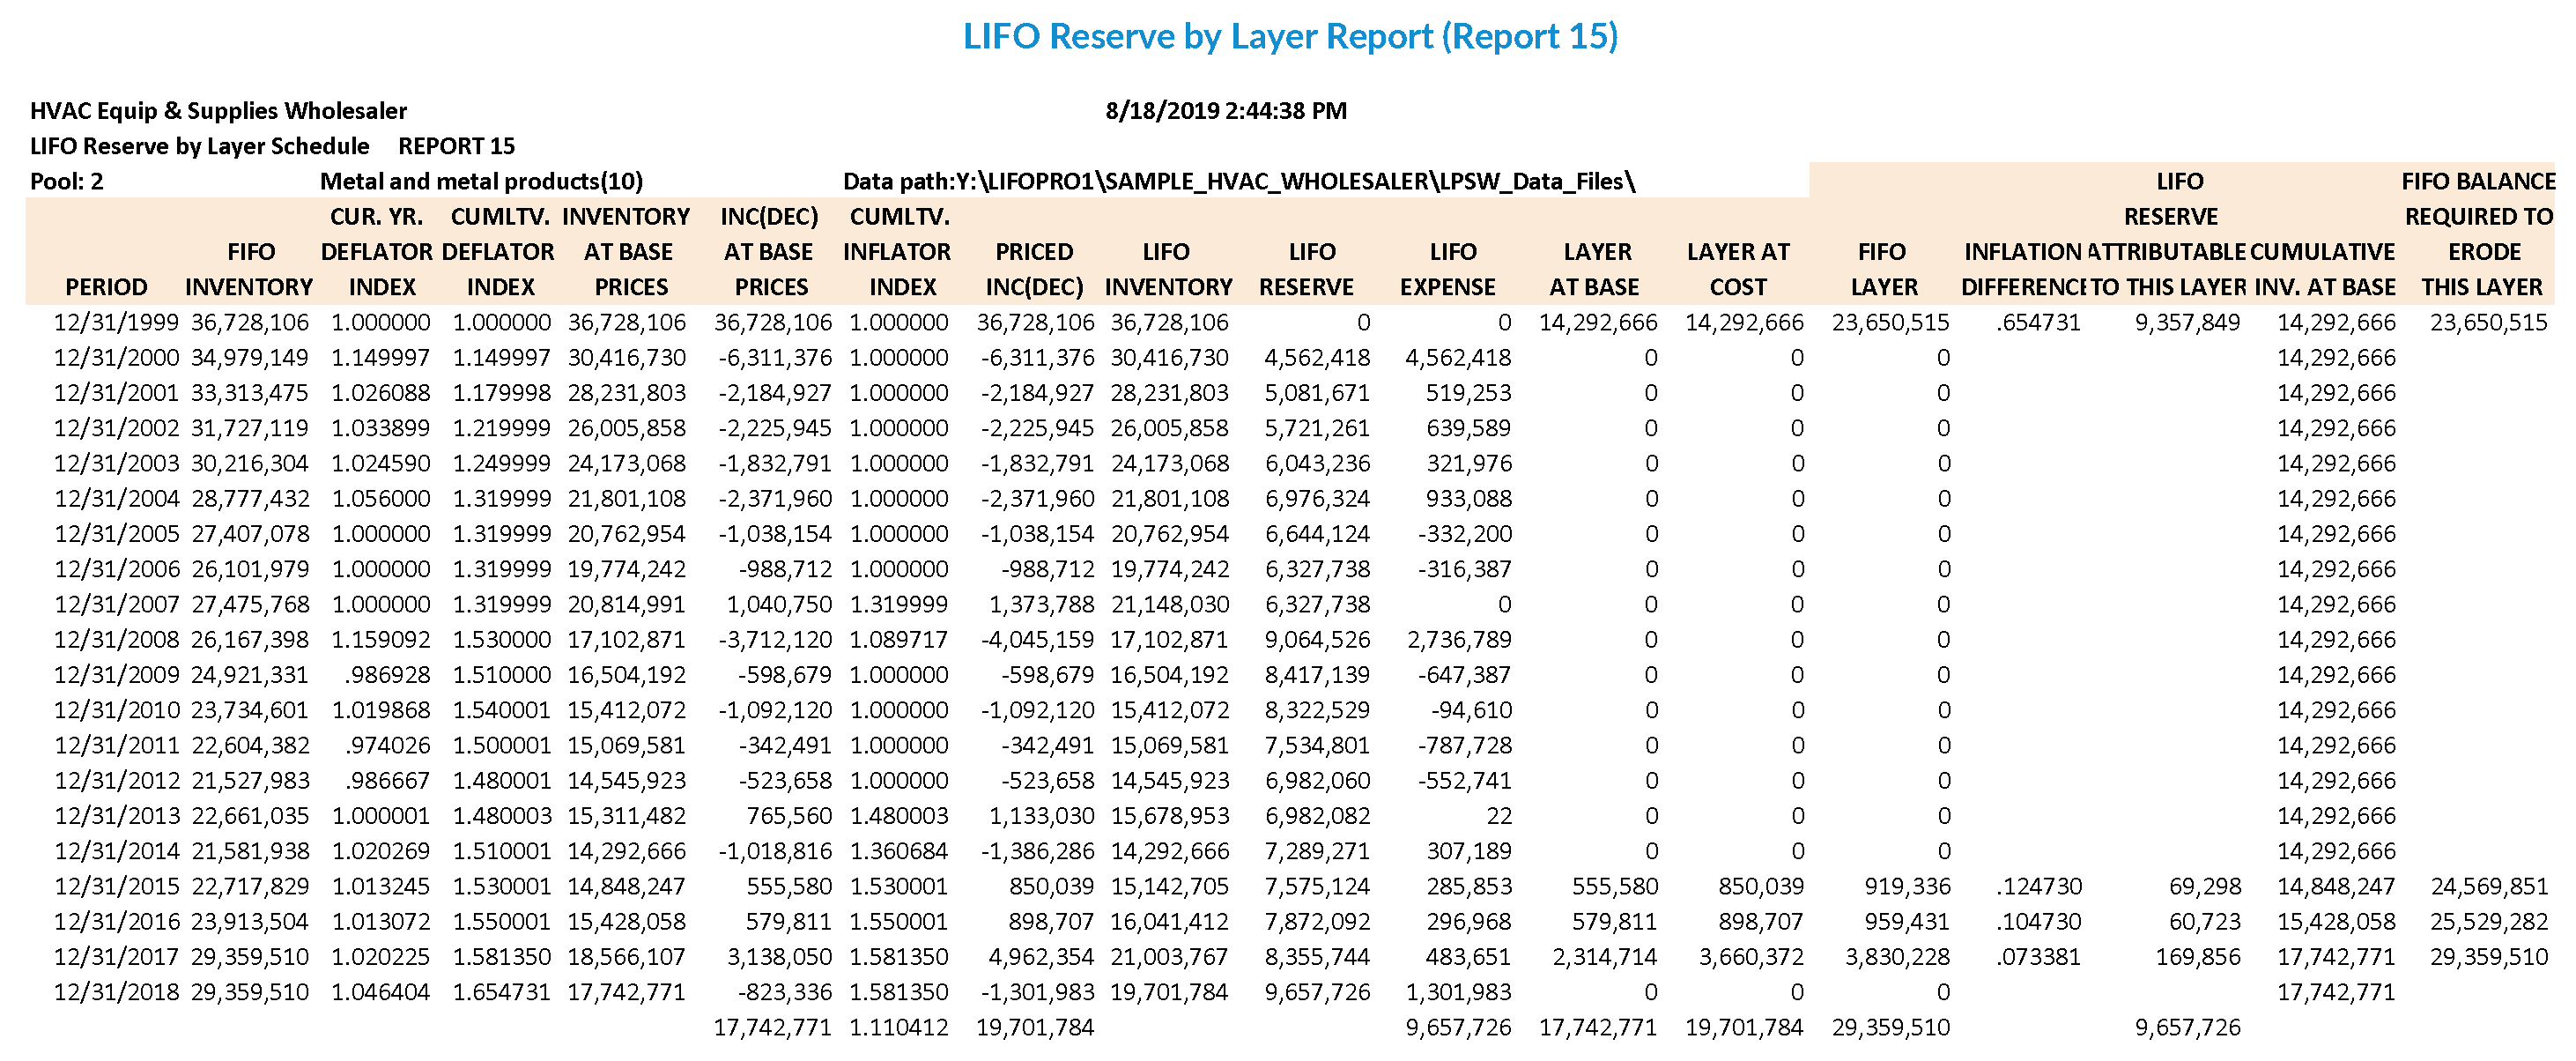
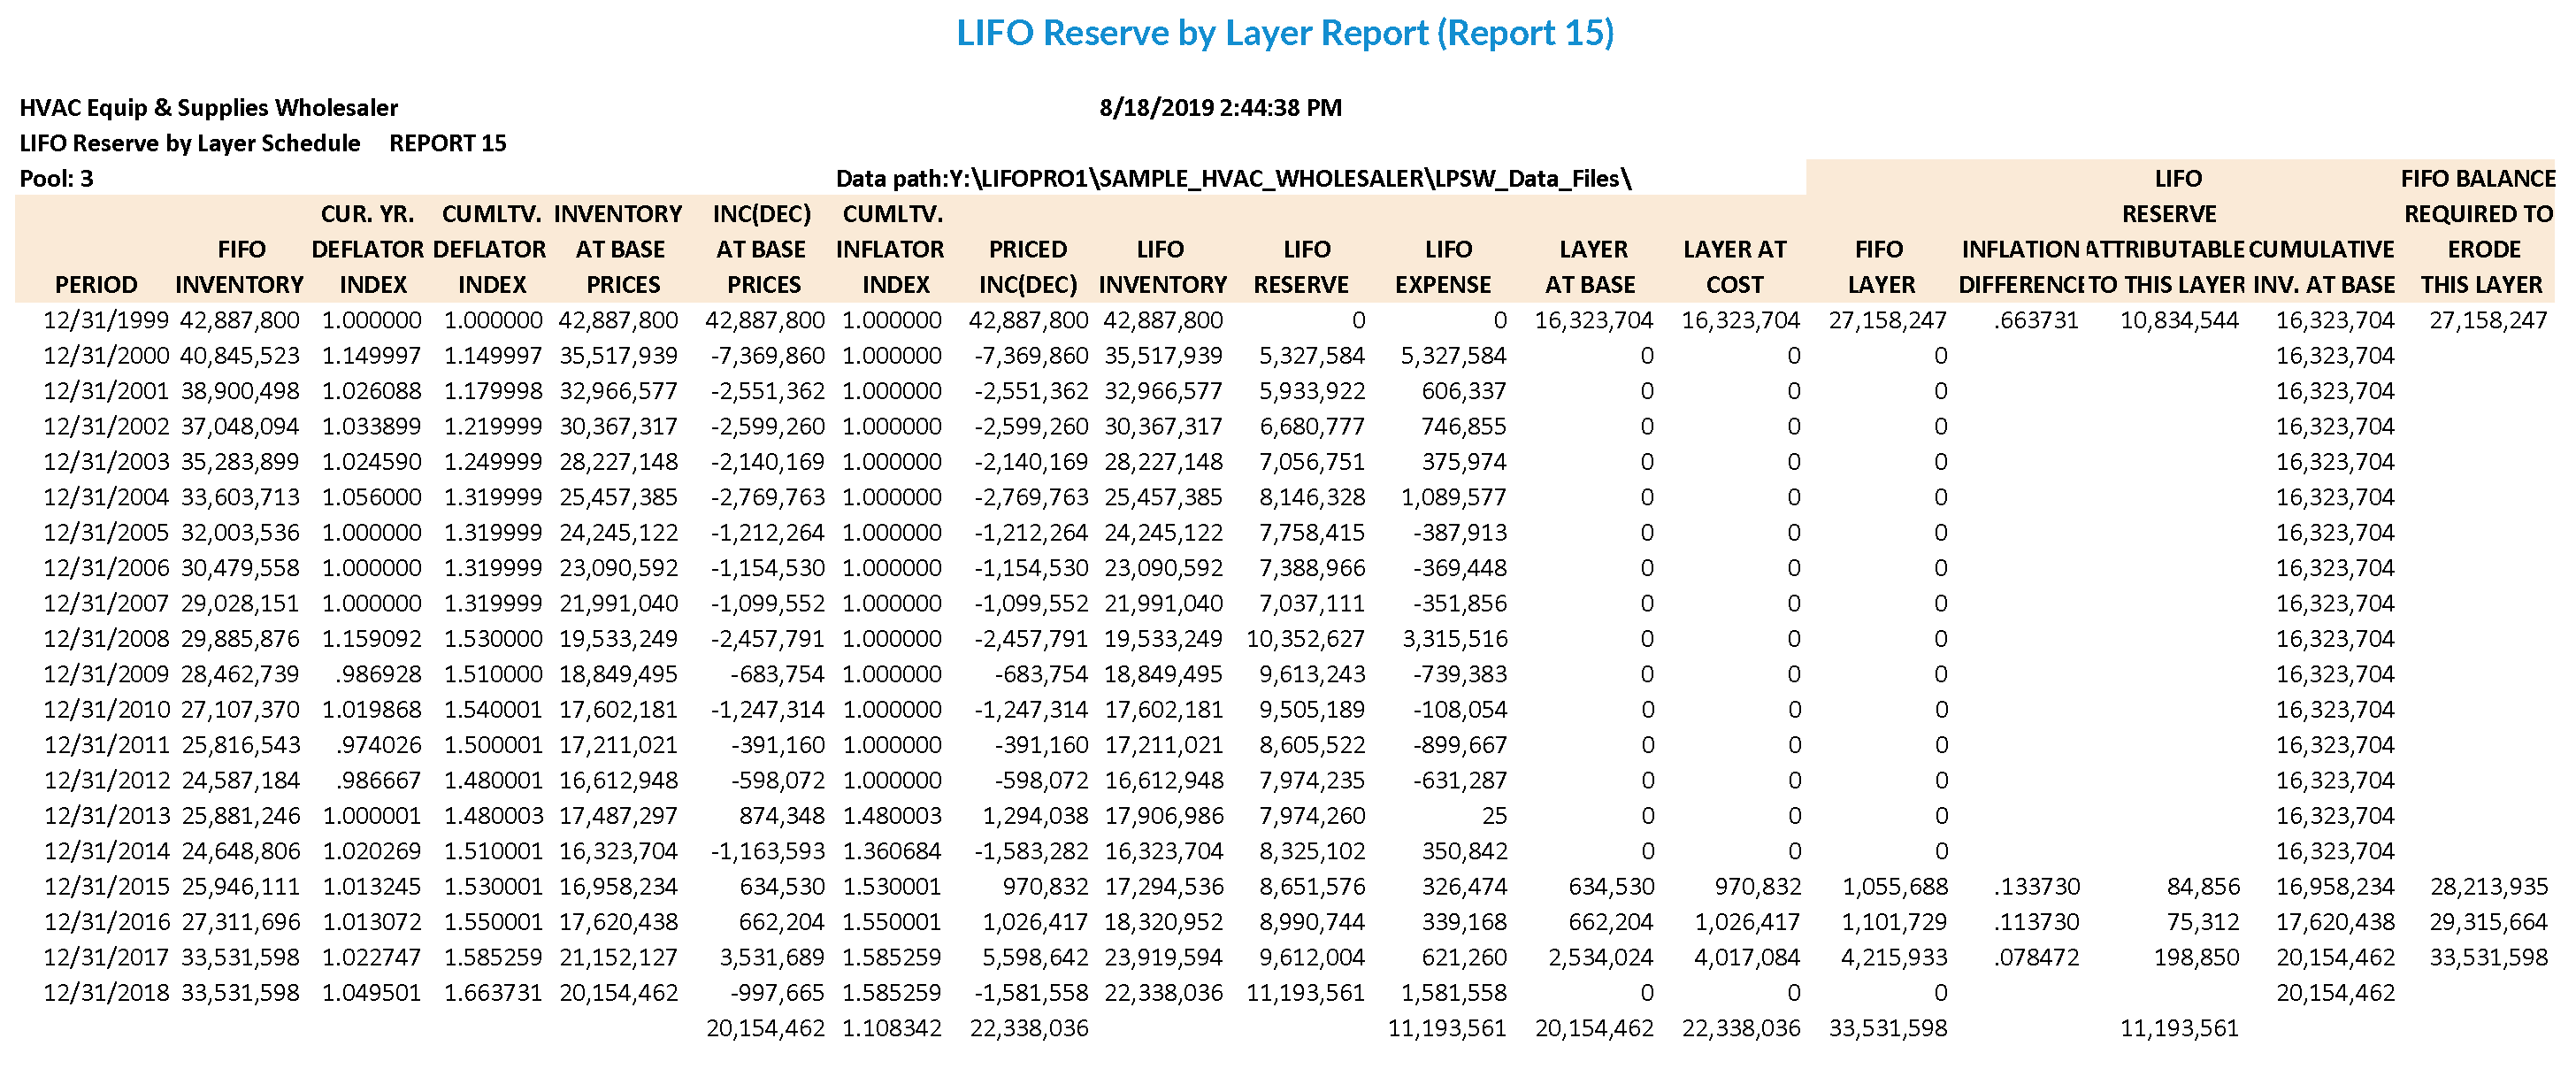
LIFO Reserve by Layer Report (Report 15) – This report shows which years’ layers the most recent year end LIFO reserve is attributable to and in what amounts along with the FIFO balance required to erode each layer. The FIFO balance shown for each year is the balance at which that layer begins to be eroded; that layer will be completely eroded (and the LIFO reserve associated with it will be removed) when the next year (following the most recently closed year end) FIFO balance is reduced to the next earliest layer remaining FIFO balance shown in the rightmost column.
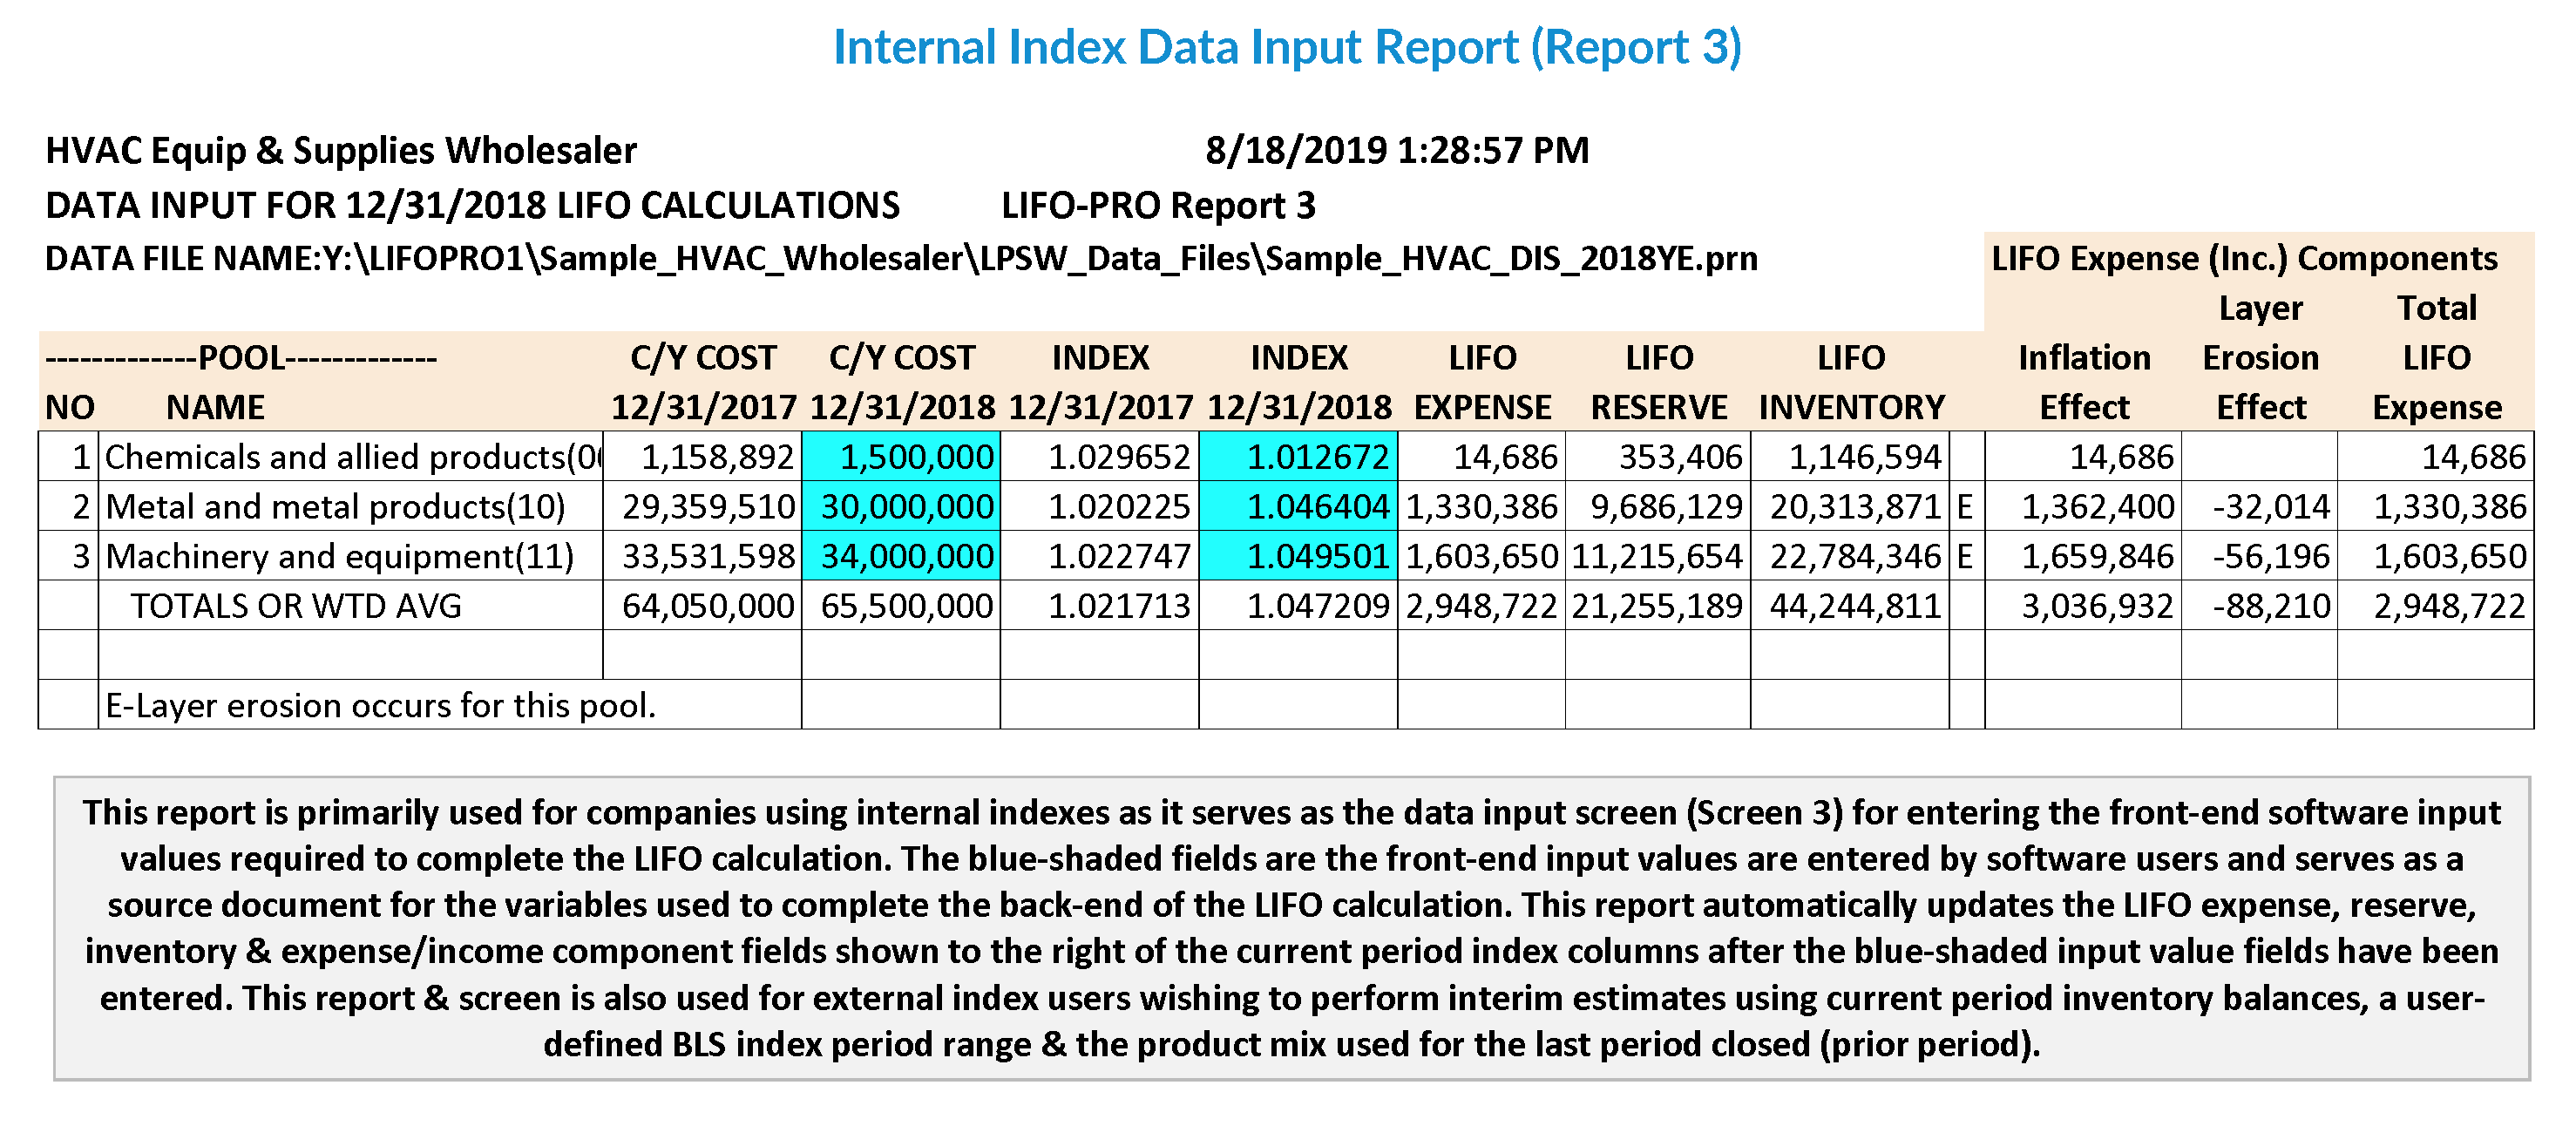
Internal Index Data Input Report (Report 3) – This report is primarily used for companies using internal indexes as it serves as the data input screen (Screen 3) for entering the front-end software input values required to complete the LIFO calculation. The blue-shaded fields are the front-end input values are entered by software users and serves as a source document for the variables used to complete the back-end of the LIFO calculation. This report automatically updates the LIFO expense, reserve, inventory & expense/income component fields shown to the right of the current period index columns after the blue-shaded input value fields have been entered. This report & screen is also used for external index users wishing to perform interim estimates using current period inventory balances, a user-defined BLS index period range & the product mix used for the last period closed (prior period).
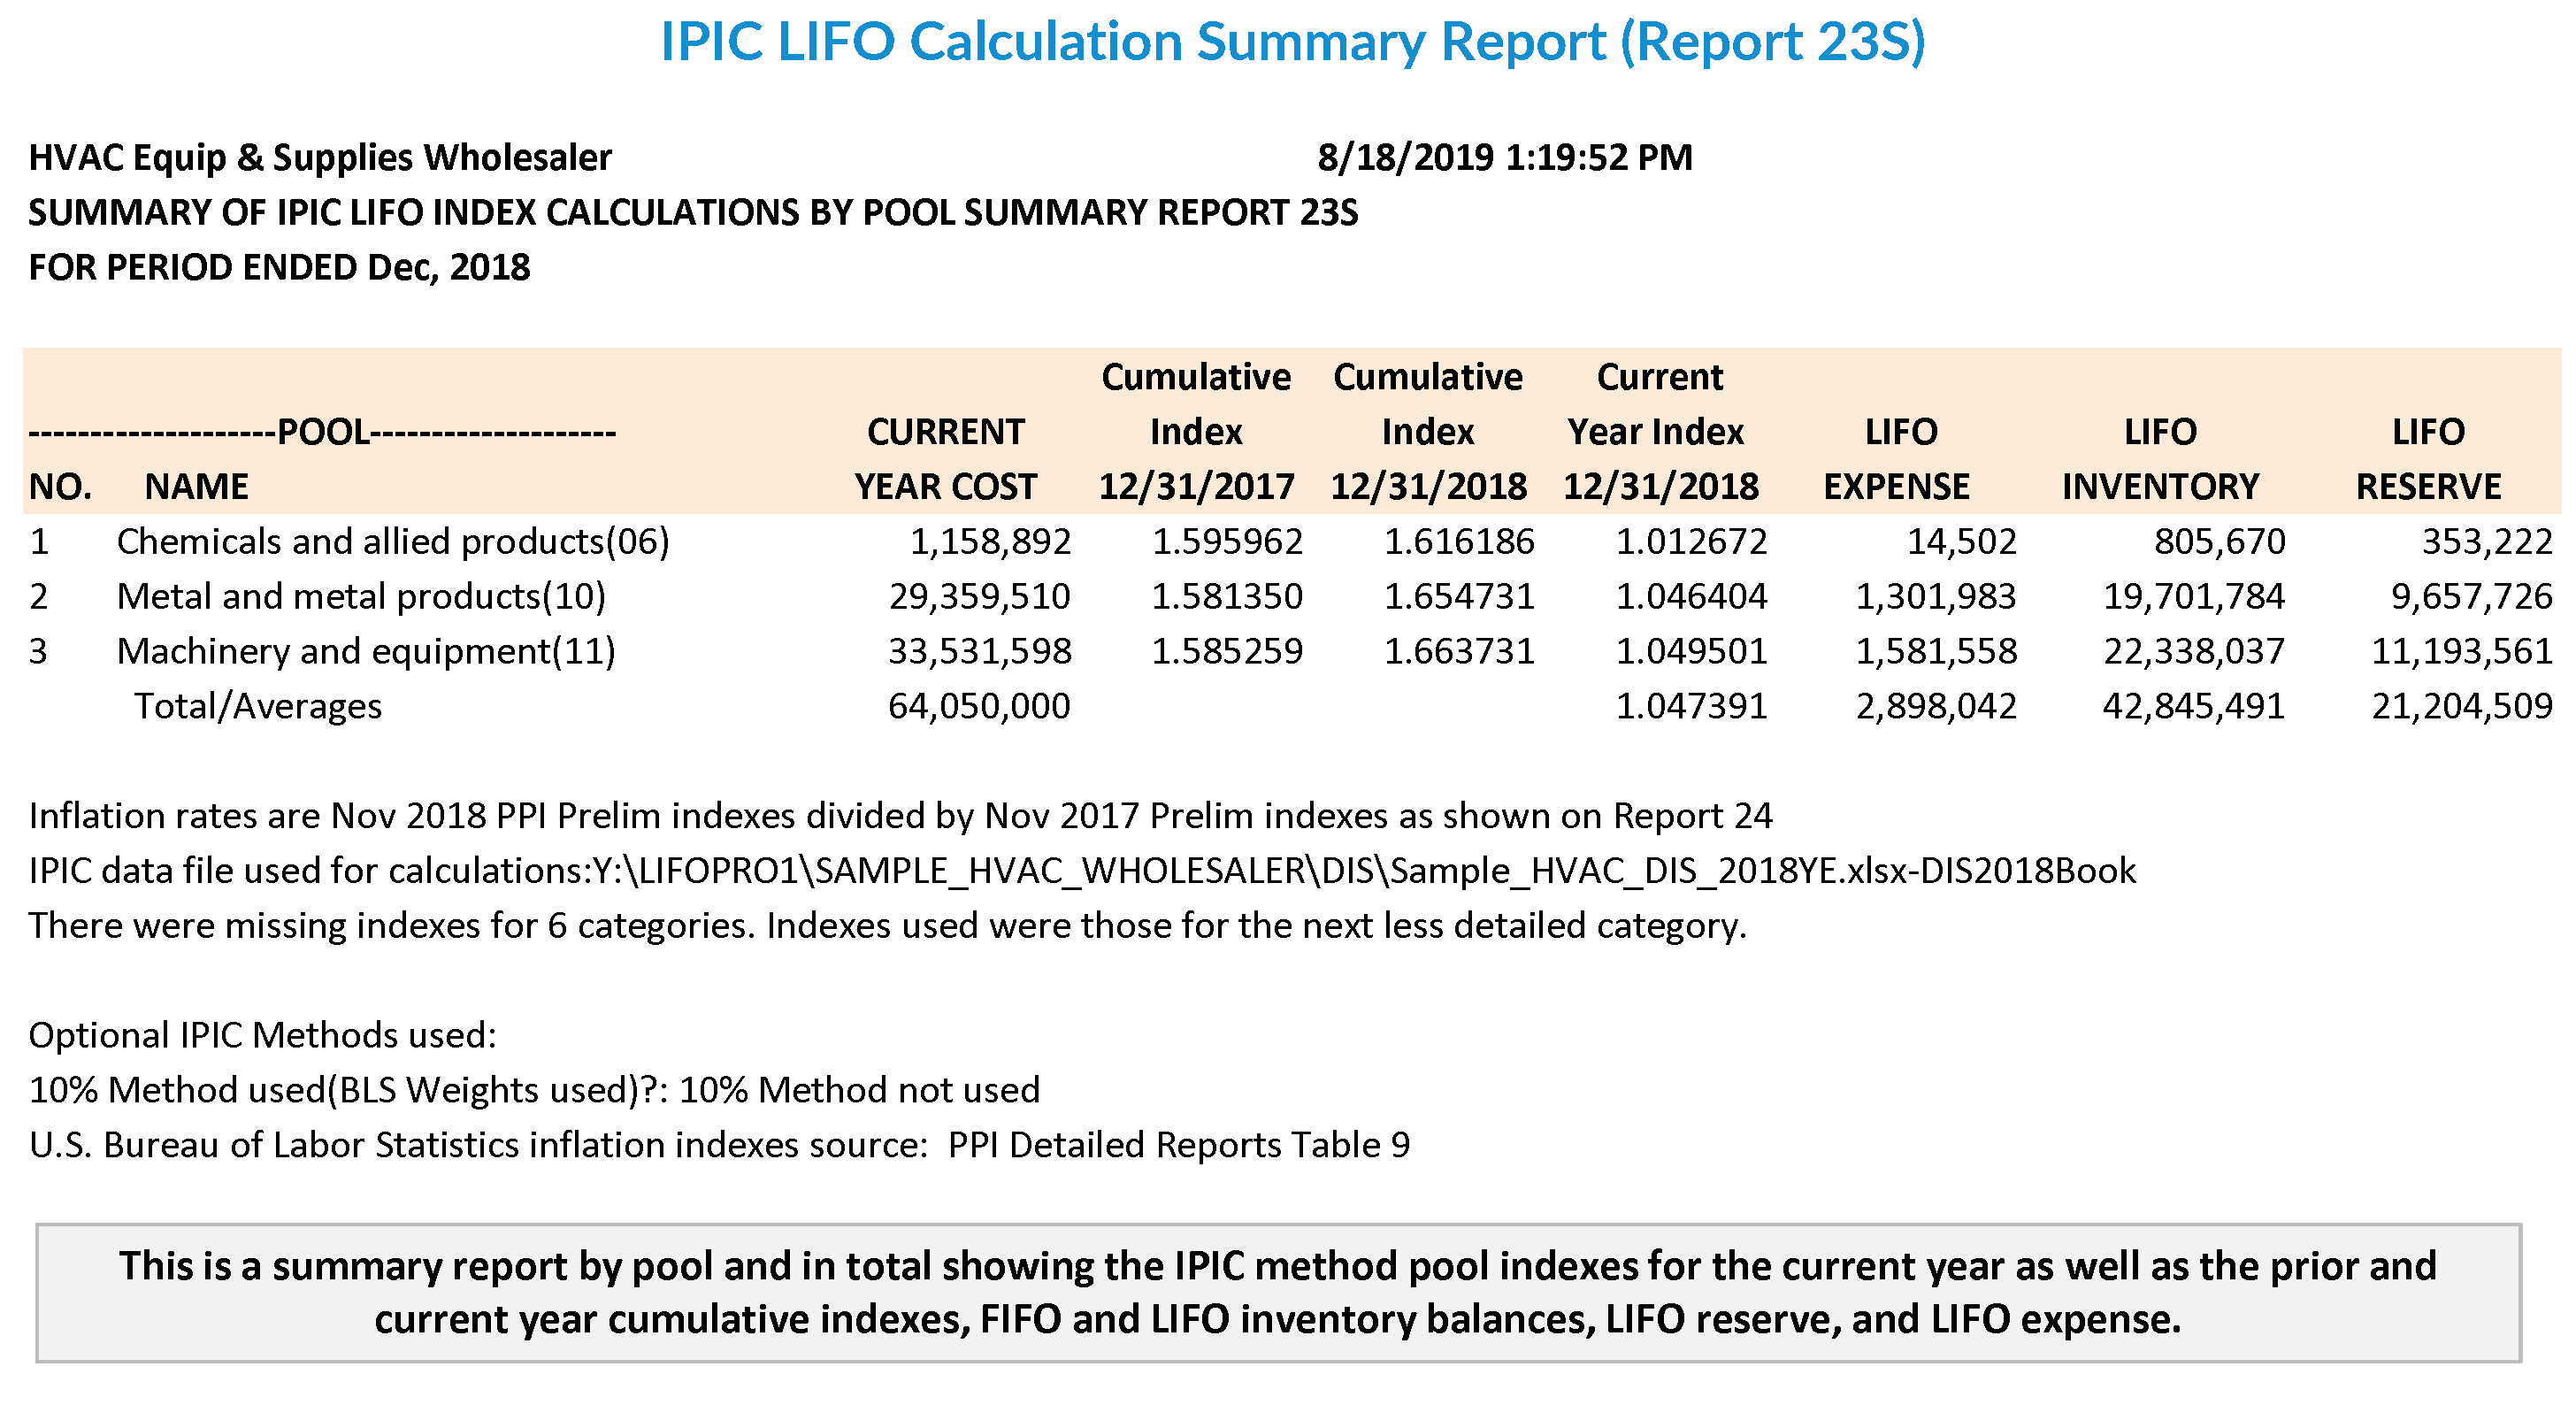
IPIC LIFO Calculation Summary Report (Report 23S) – This is a summary report by pool and in total showing the IPIC method pool indexes for the current year as well as the prior and current year cumulative indexes, FIFO and LIFO inventory balances, LIFO reserve, and LIFO expense.
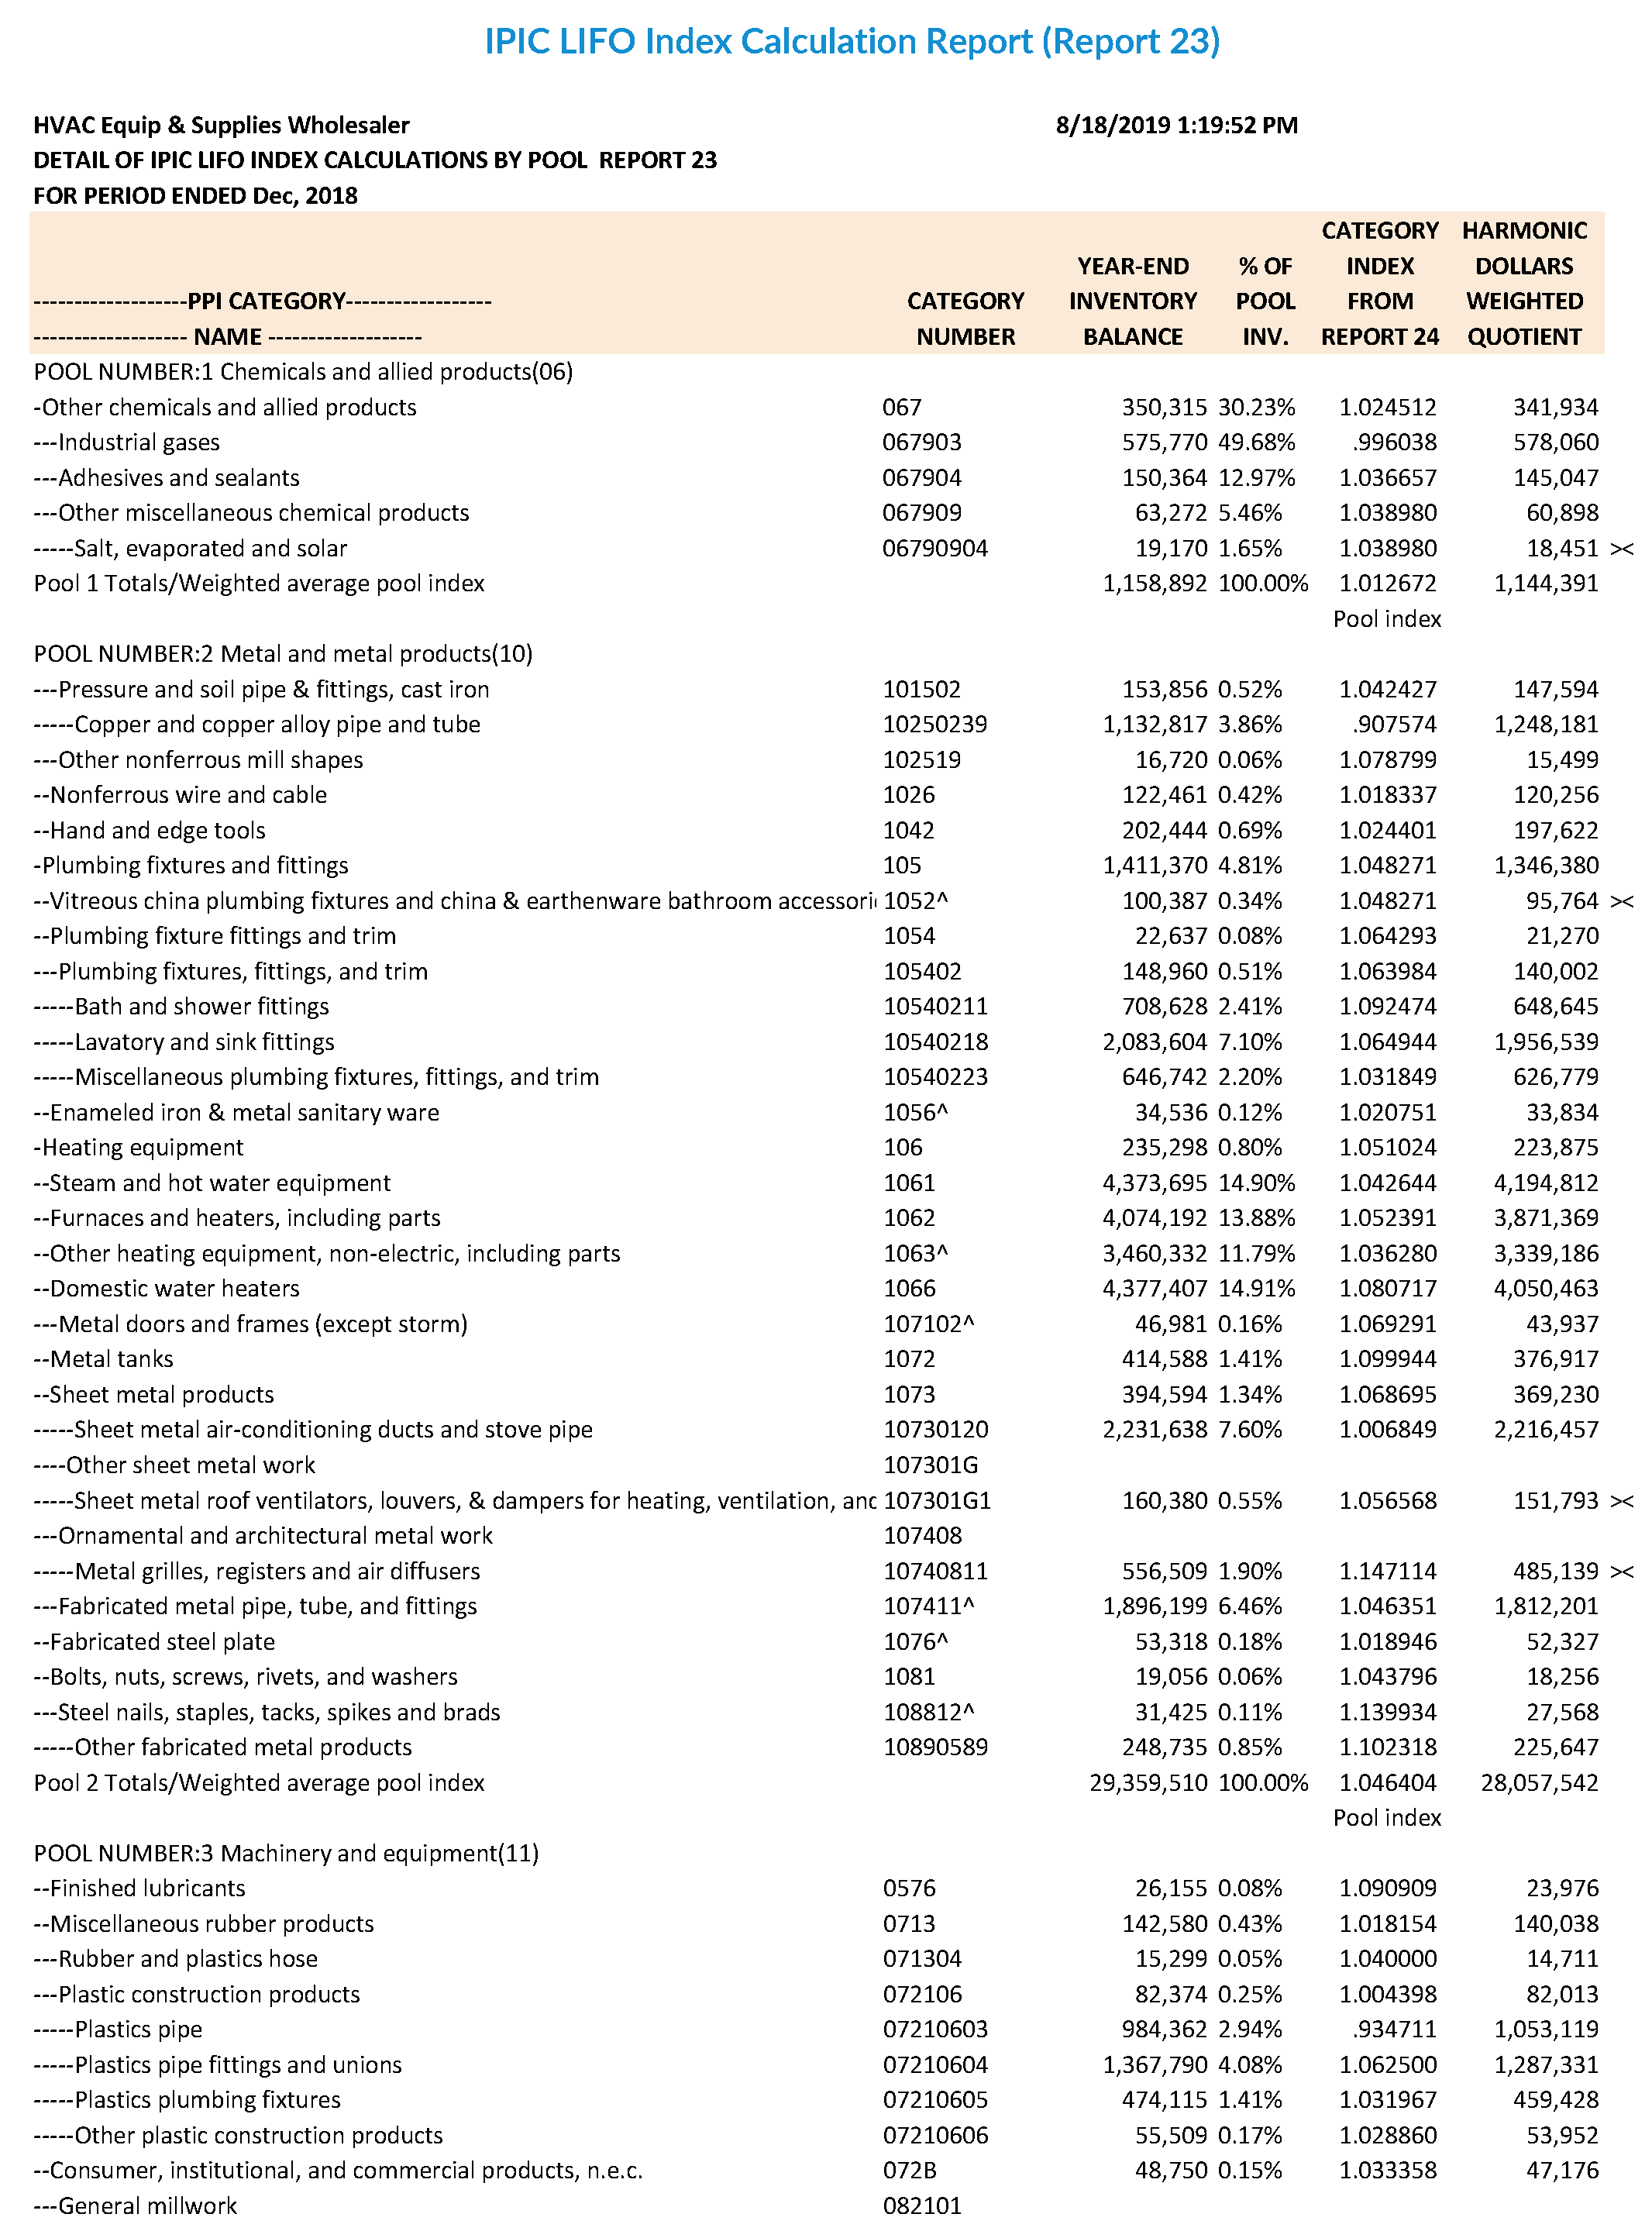
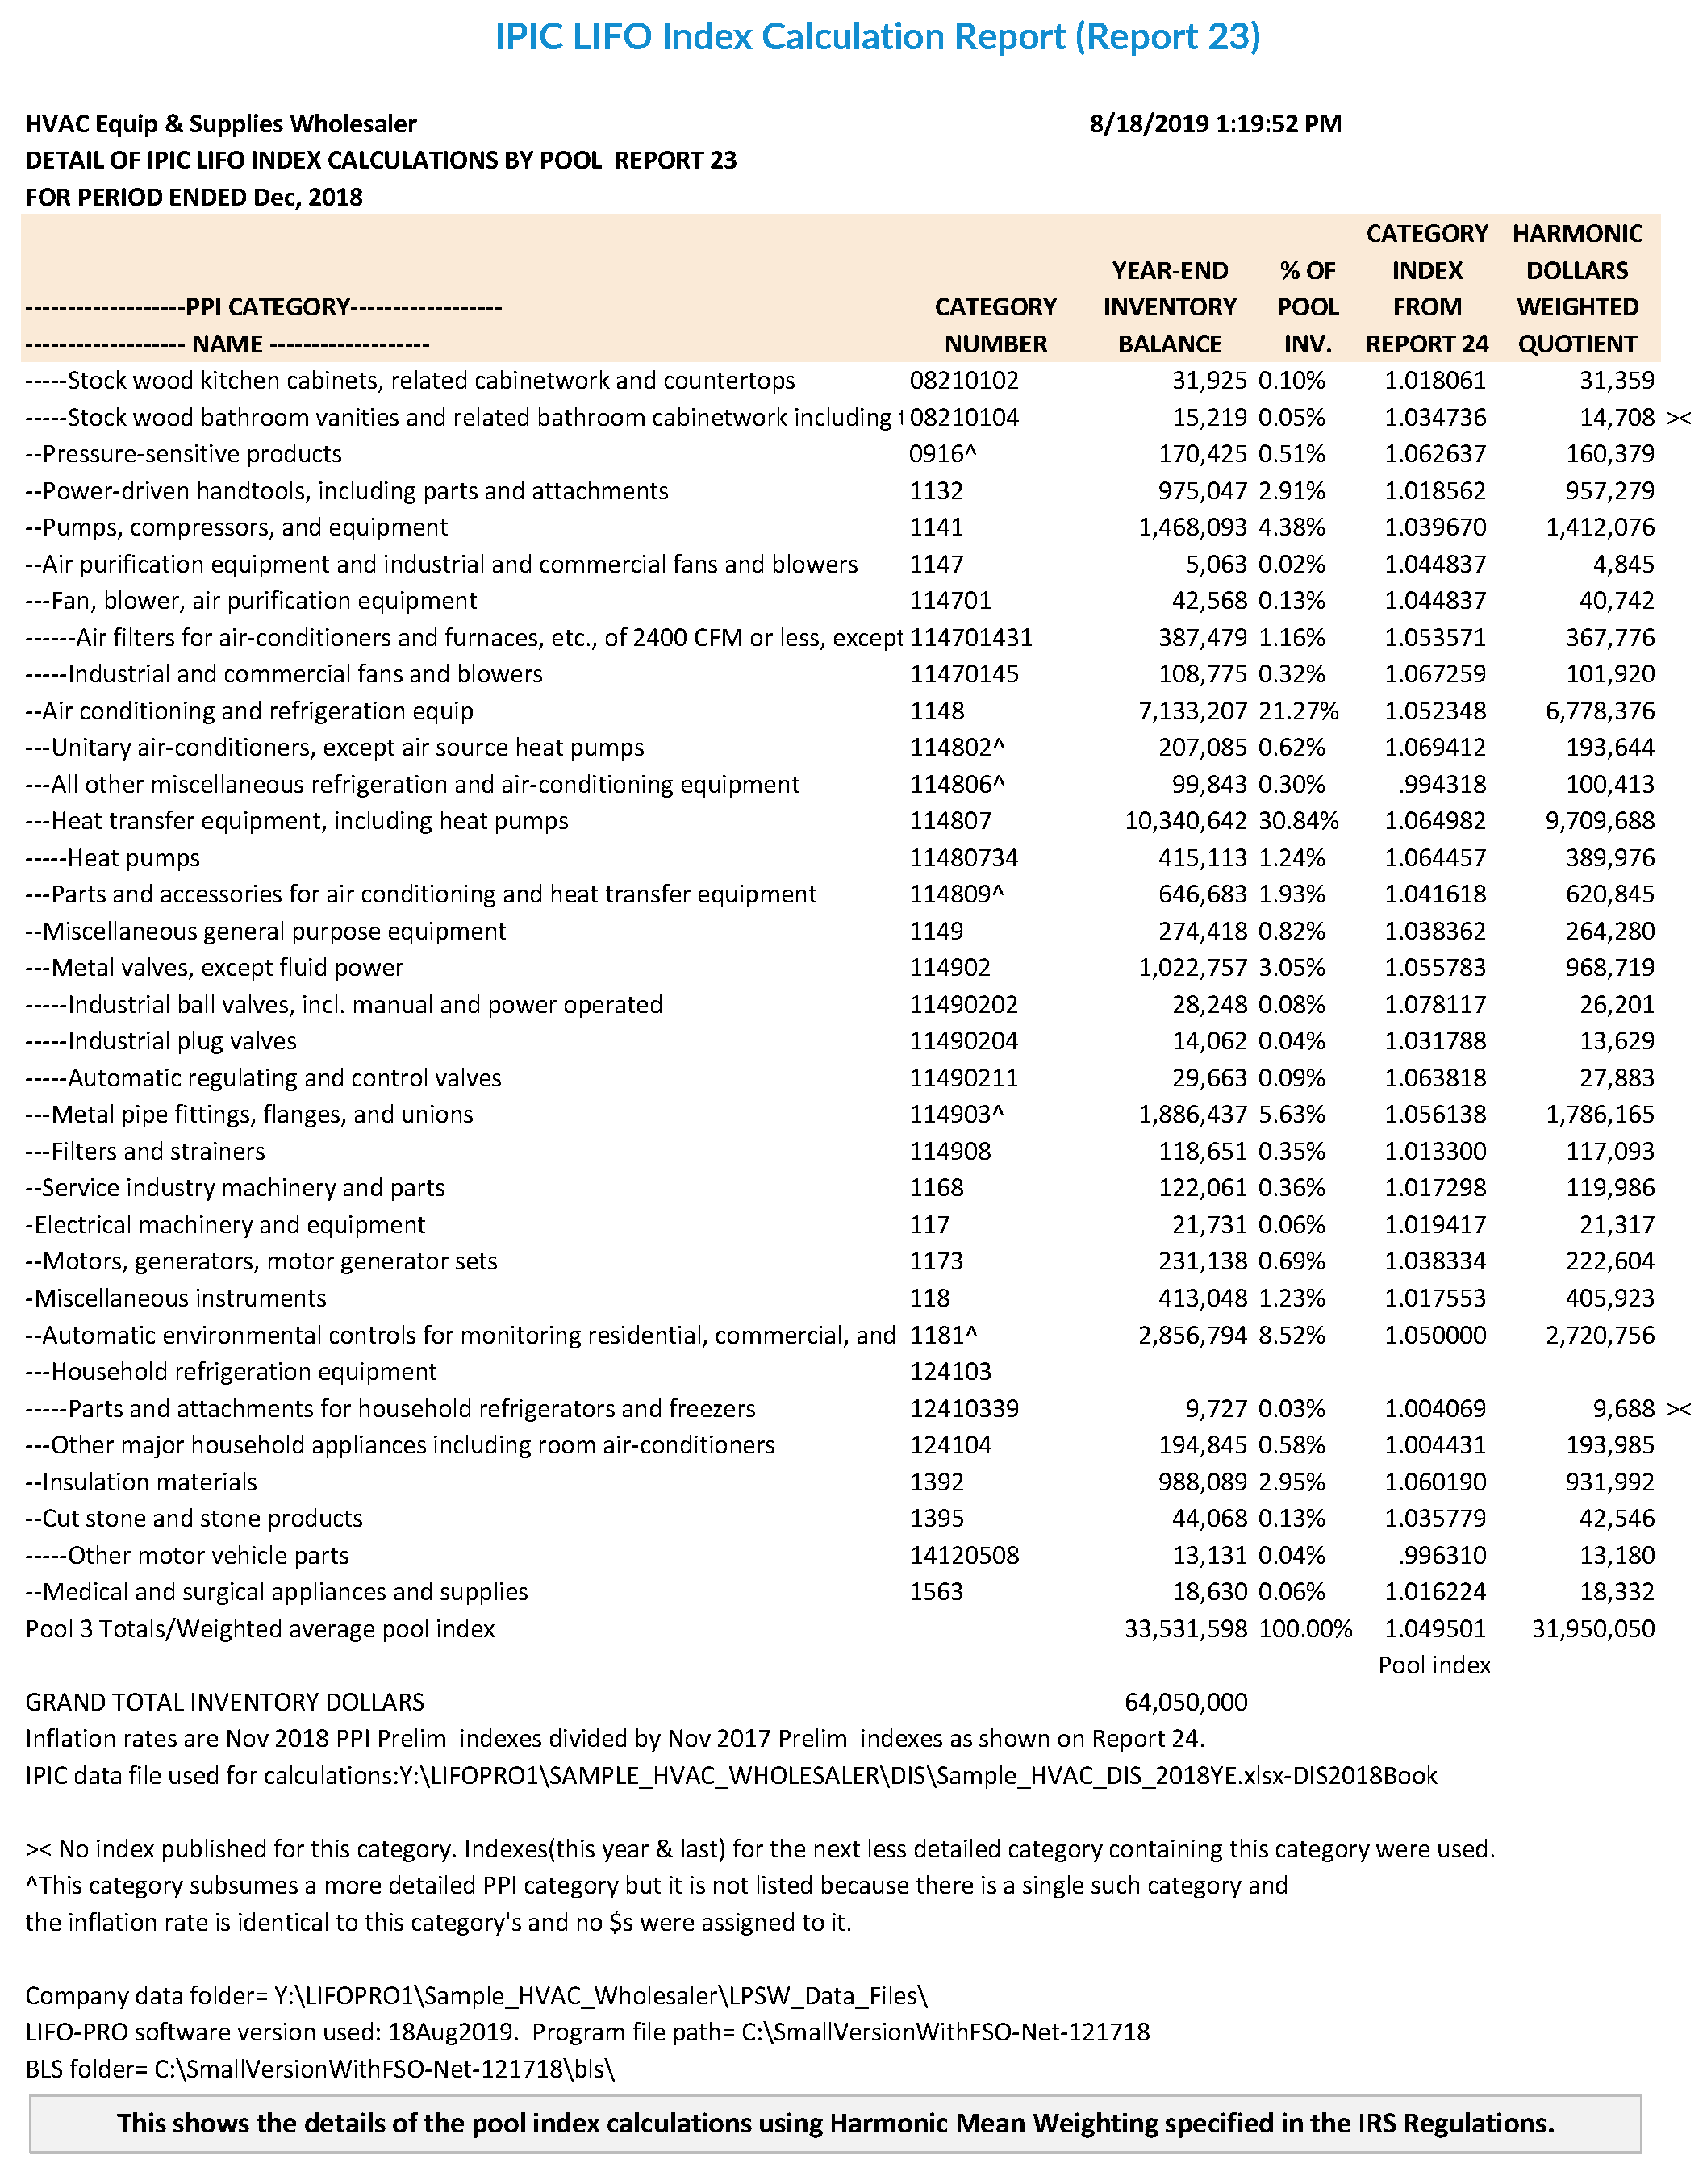
IPIC LIFO Index Calculation Report (Report 23) – This shows the details of the pool index calculations using Harmonic Mean Weighting specified in the IRS Regulations.
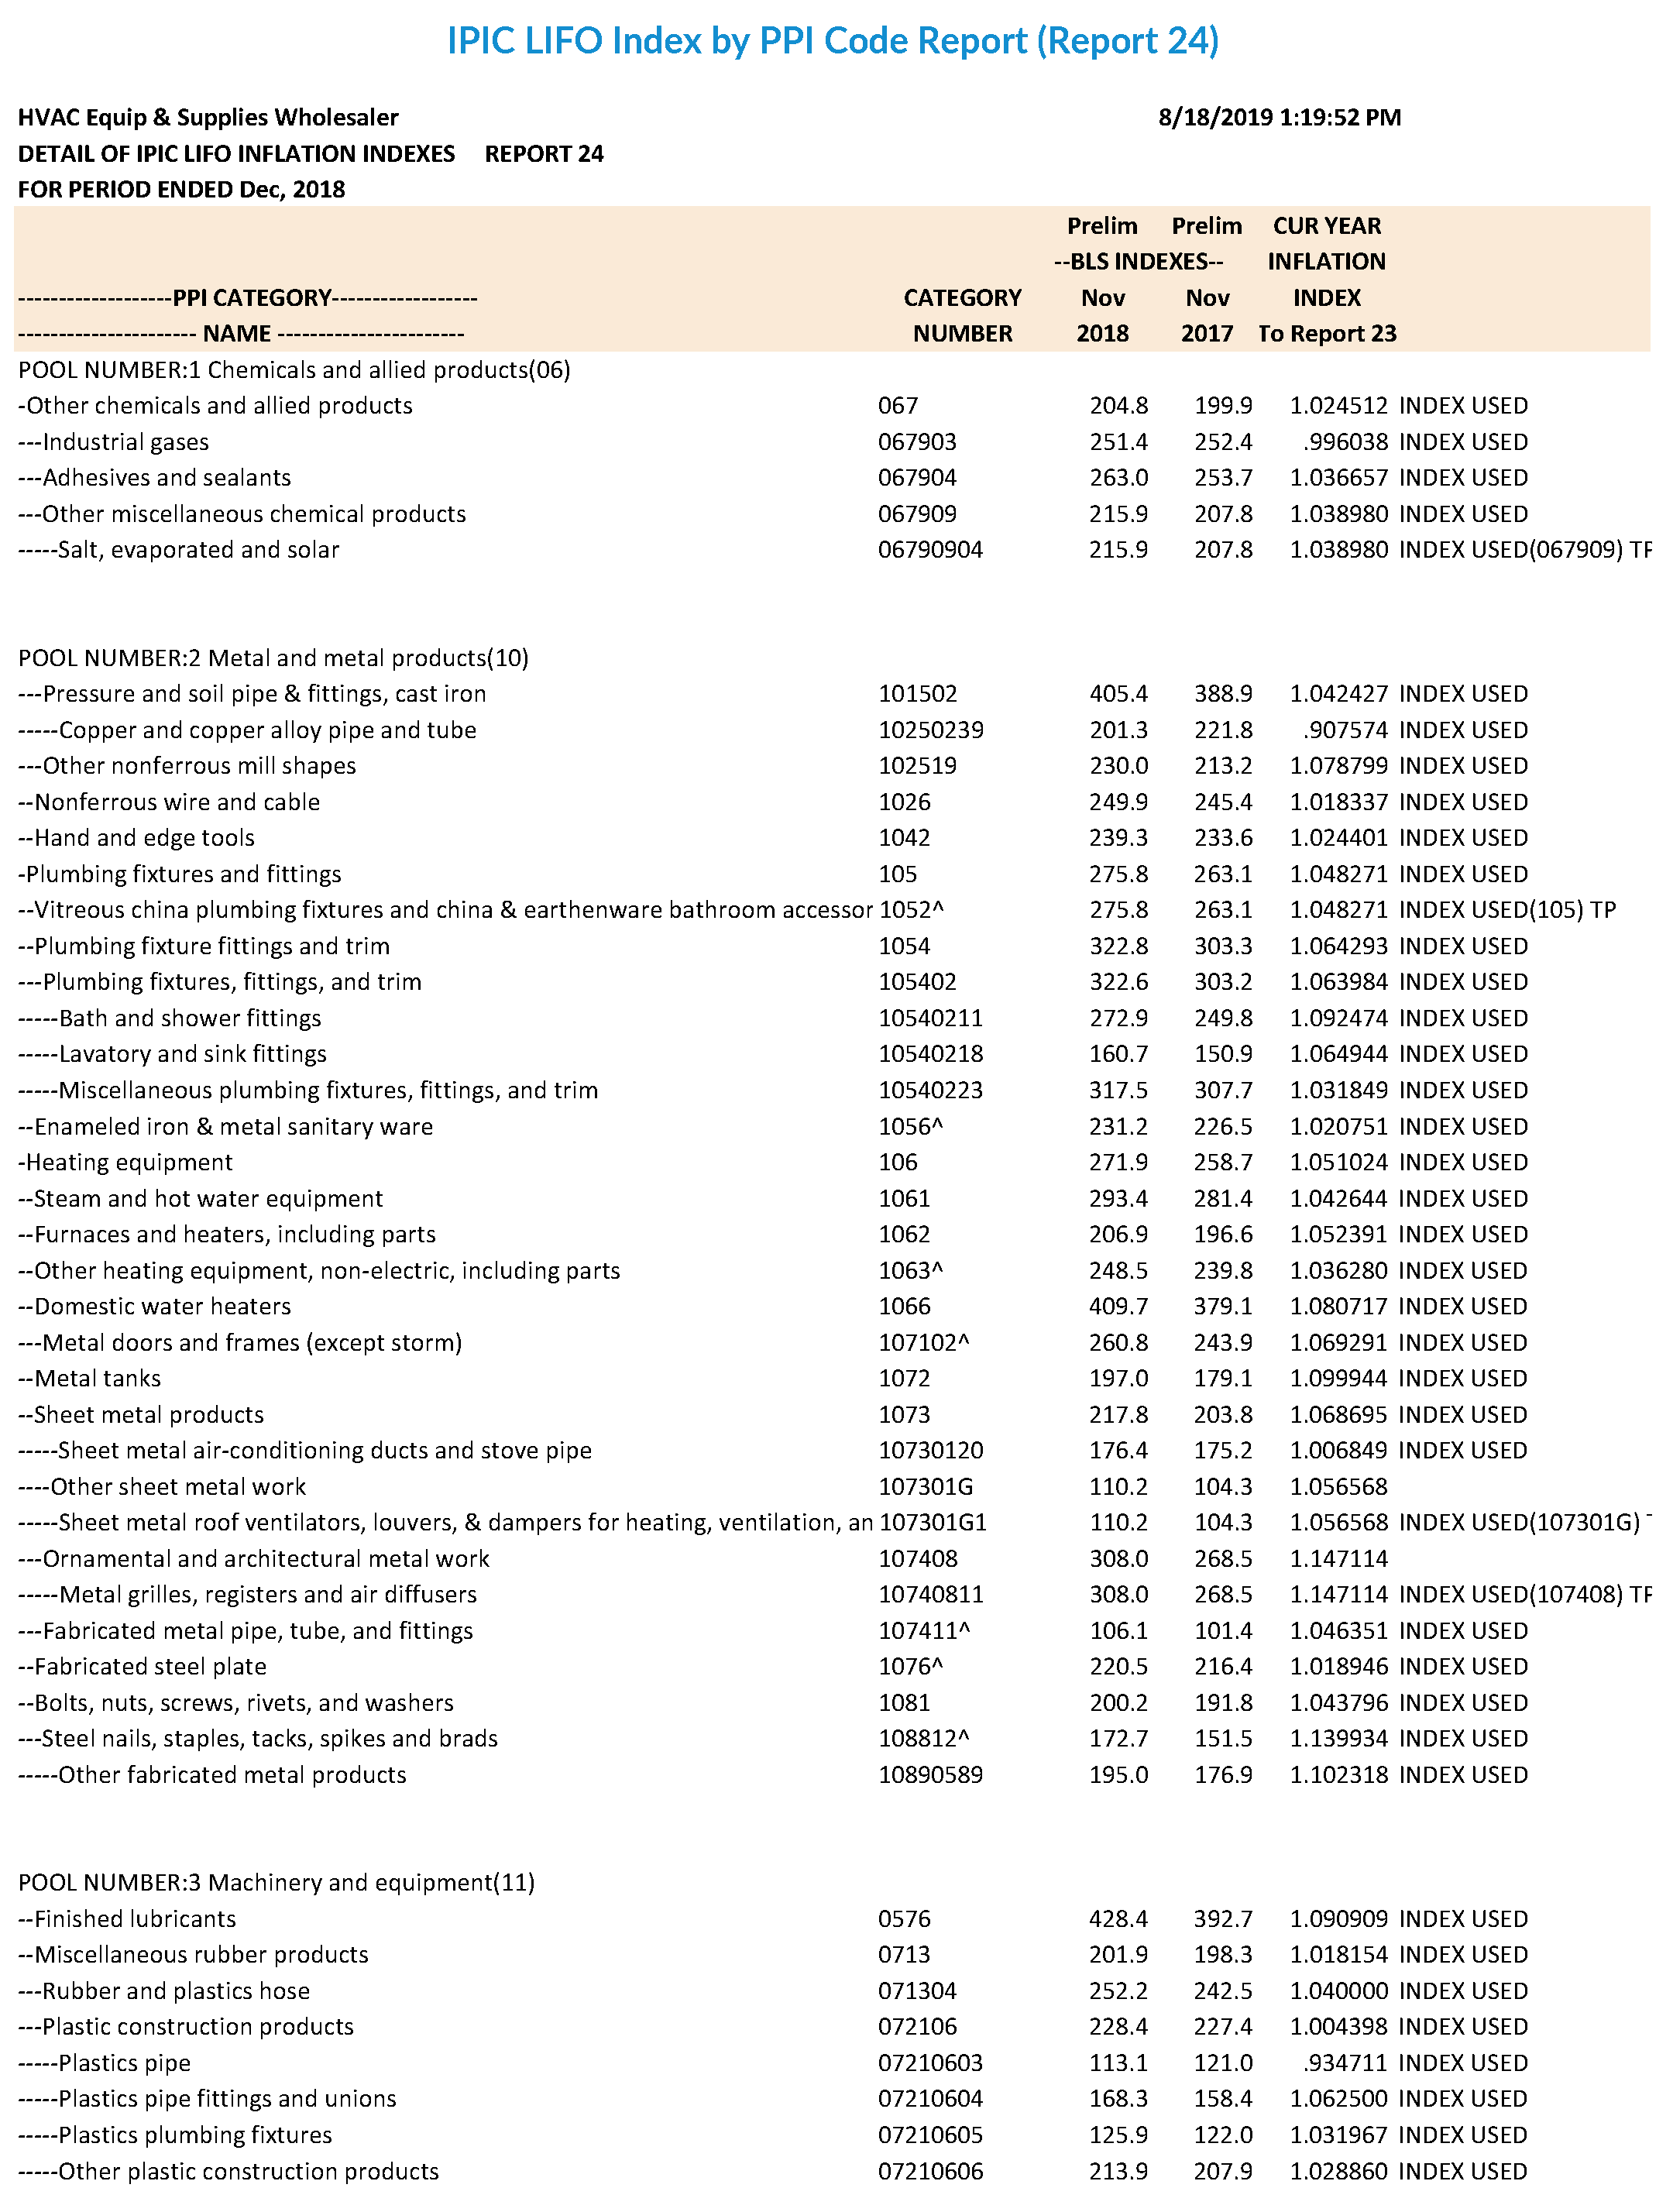
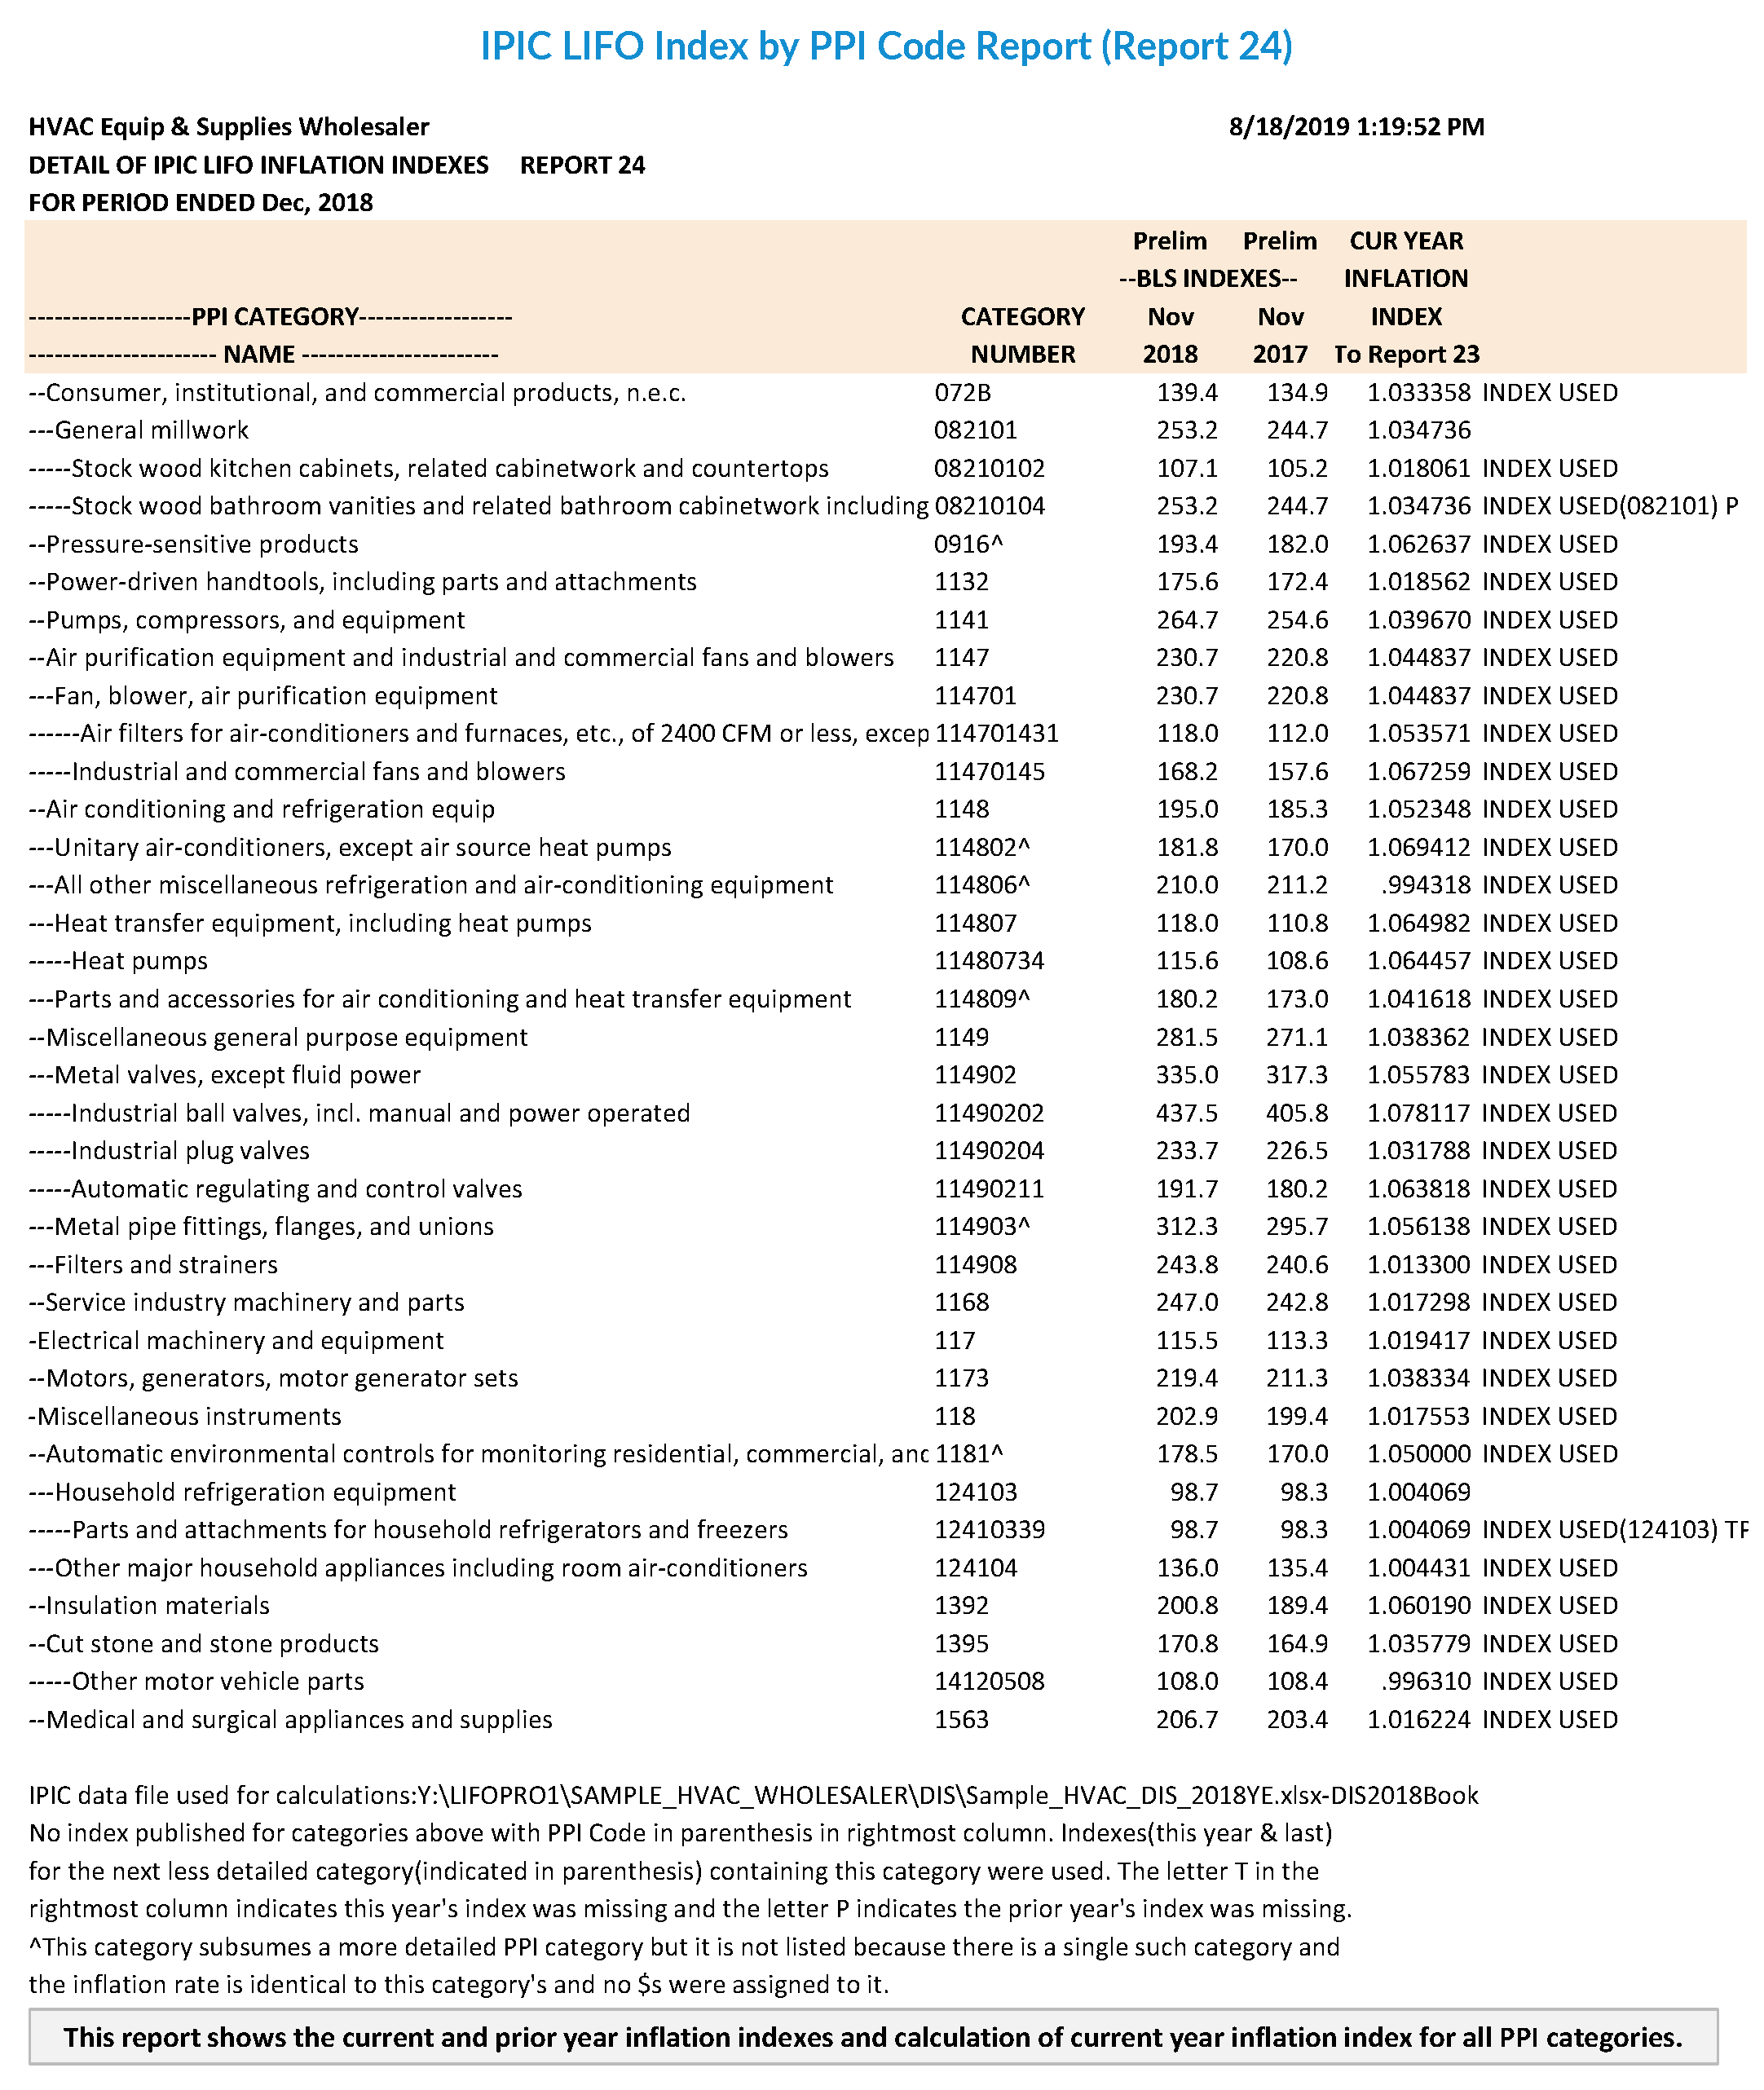
IPIC LIFO Index by PPI Code Report (Report 24) – This report shows the current and prior year inflation indexes and calculation of current year inflation index for all PPI categories.
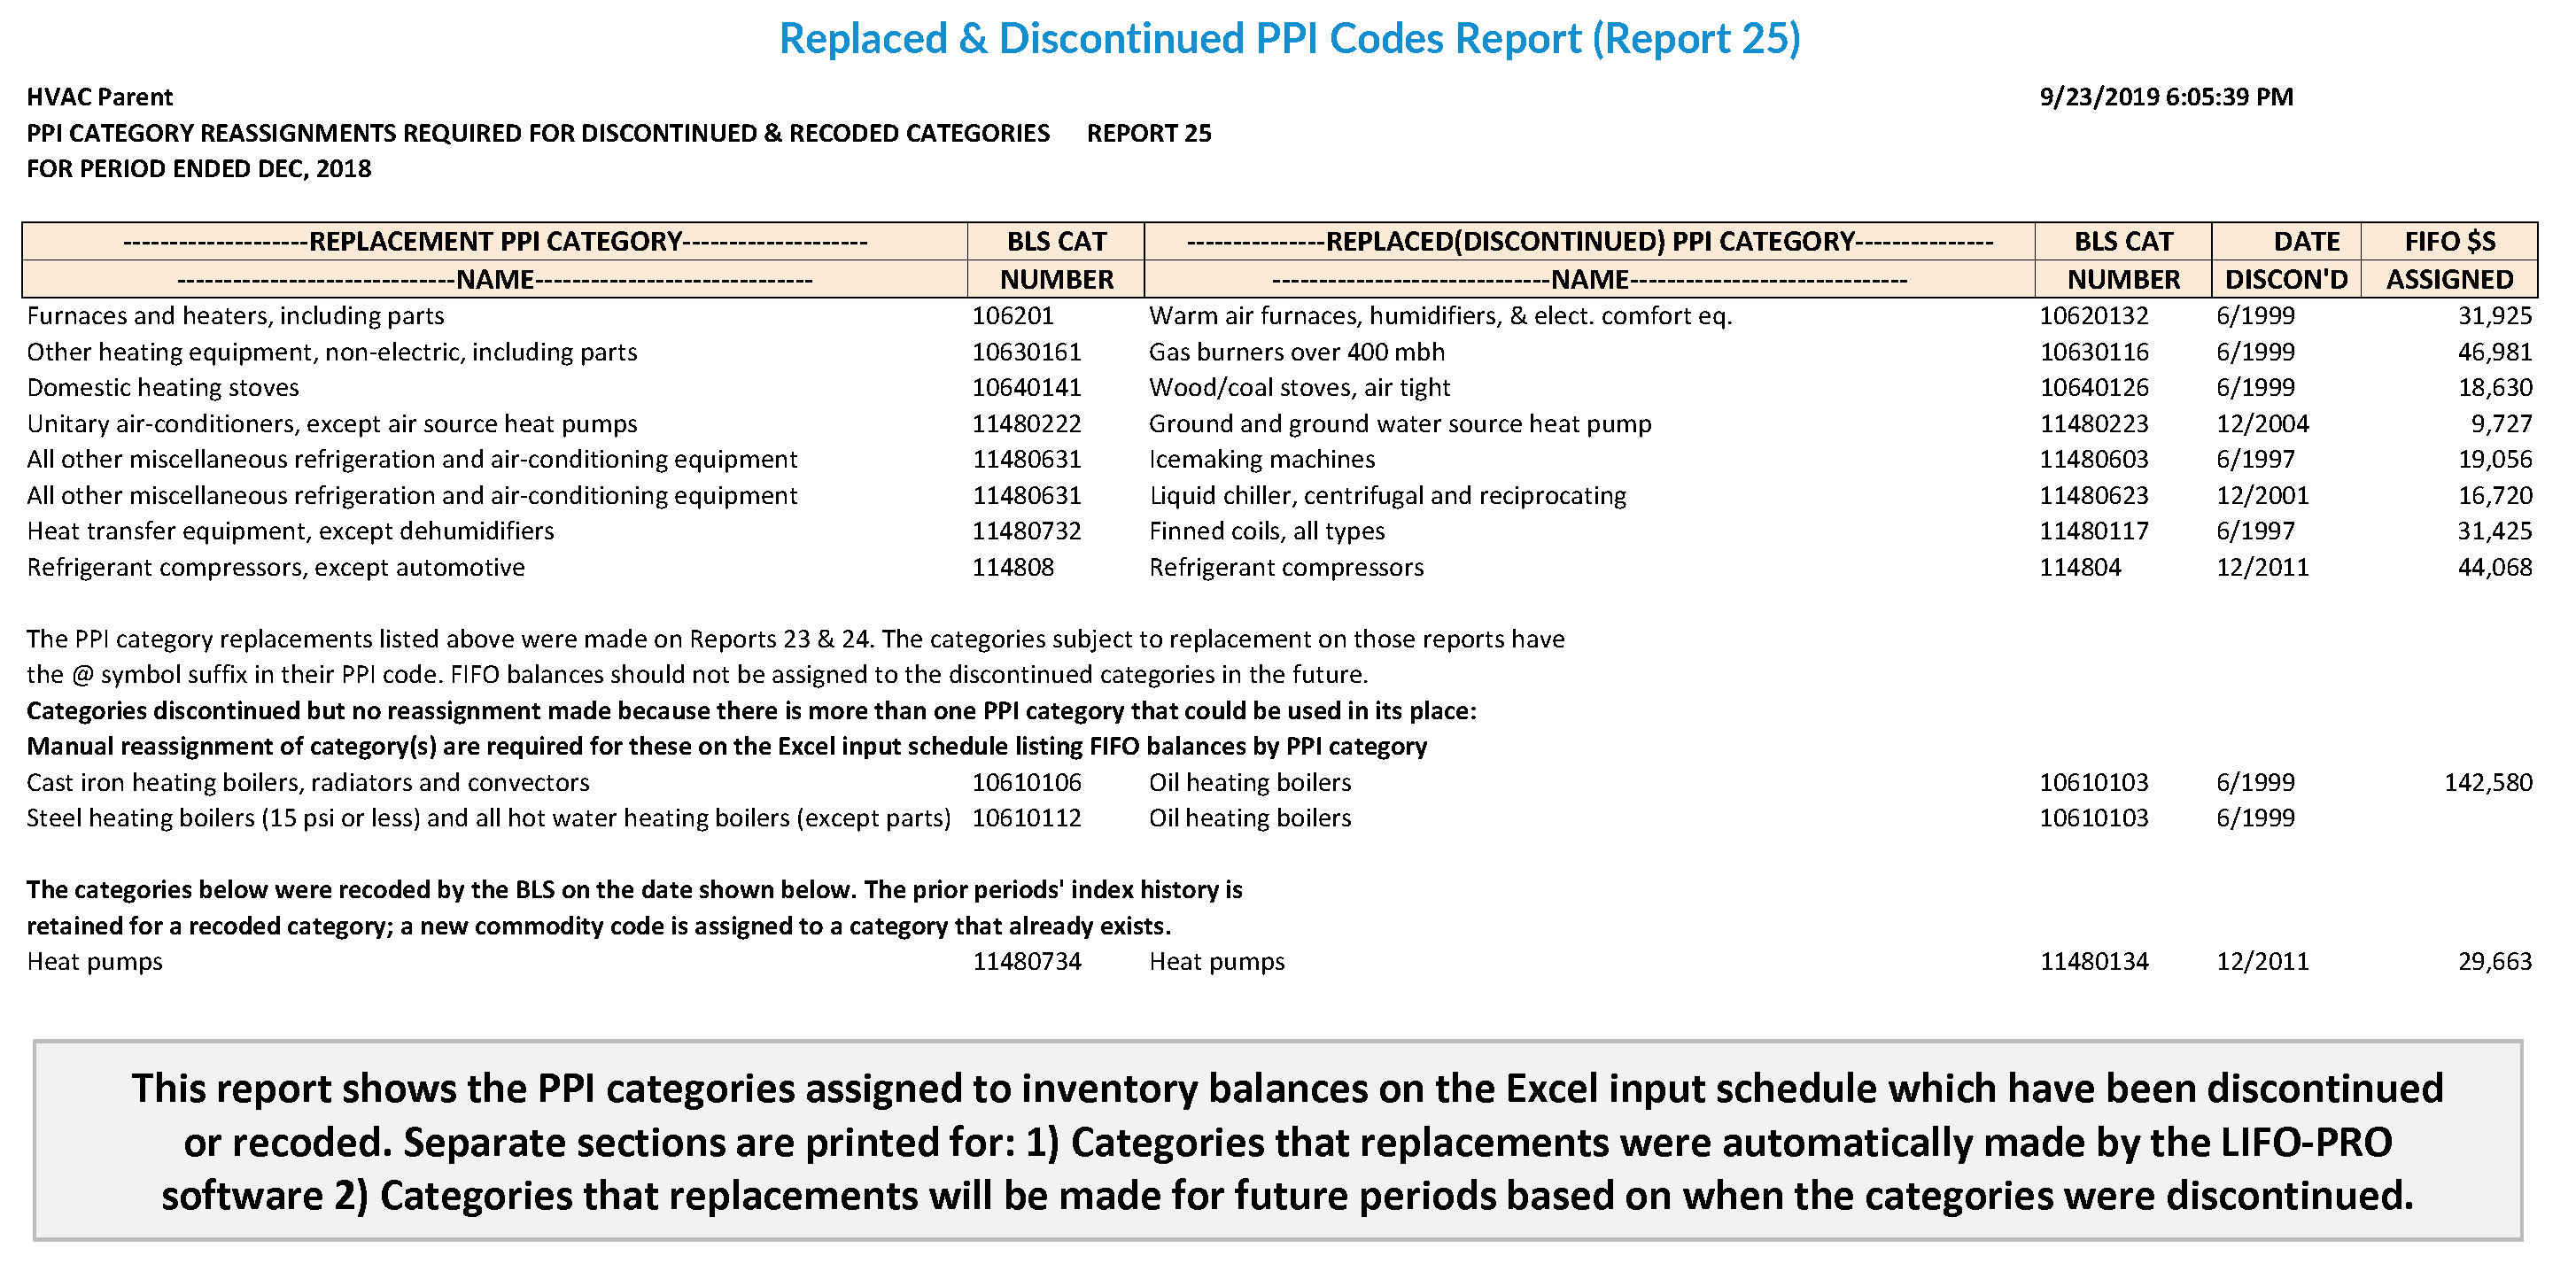
Replaced & Discontinued PPI Codes Report (Report 25) – This report shows the PPI categories assigned to inventory balances on the Excel input schedule which have been discontinued or recoded. Separate sections are printed for: 1) Categories that replacements were automatically made by the LIFO-PRO software 2) Categories that replacements will be made for future periods based on when the categories were discontinued.
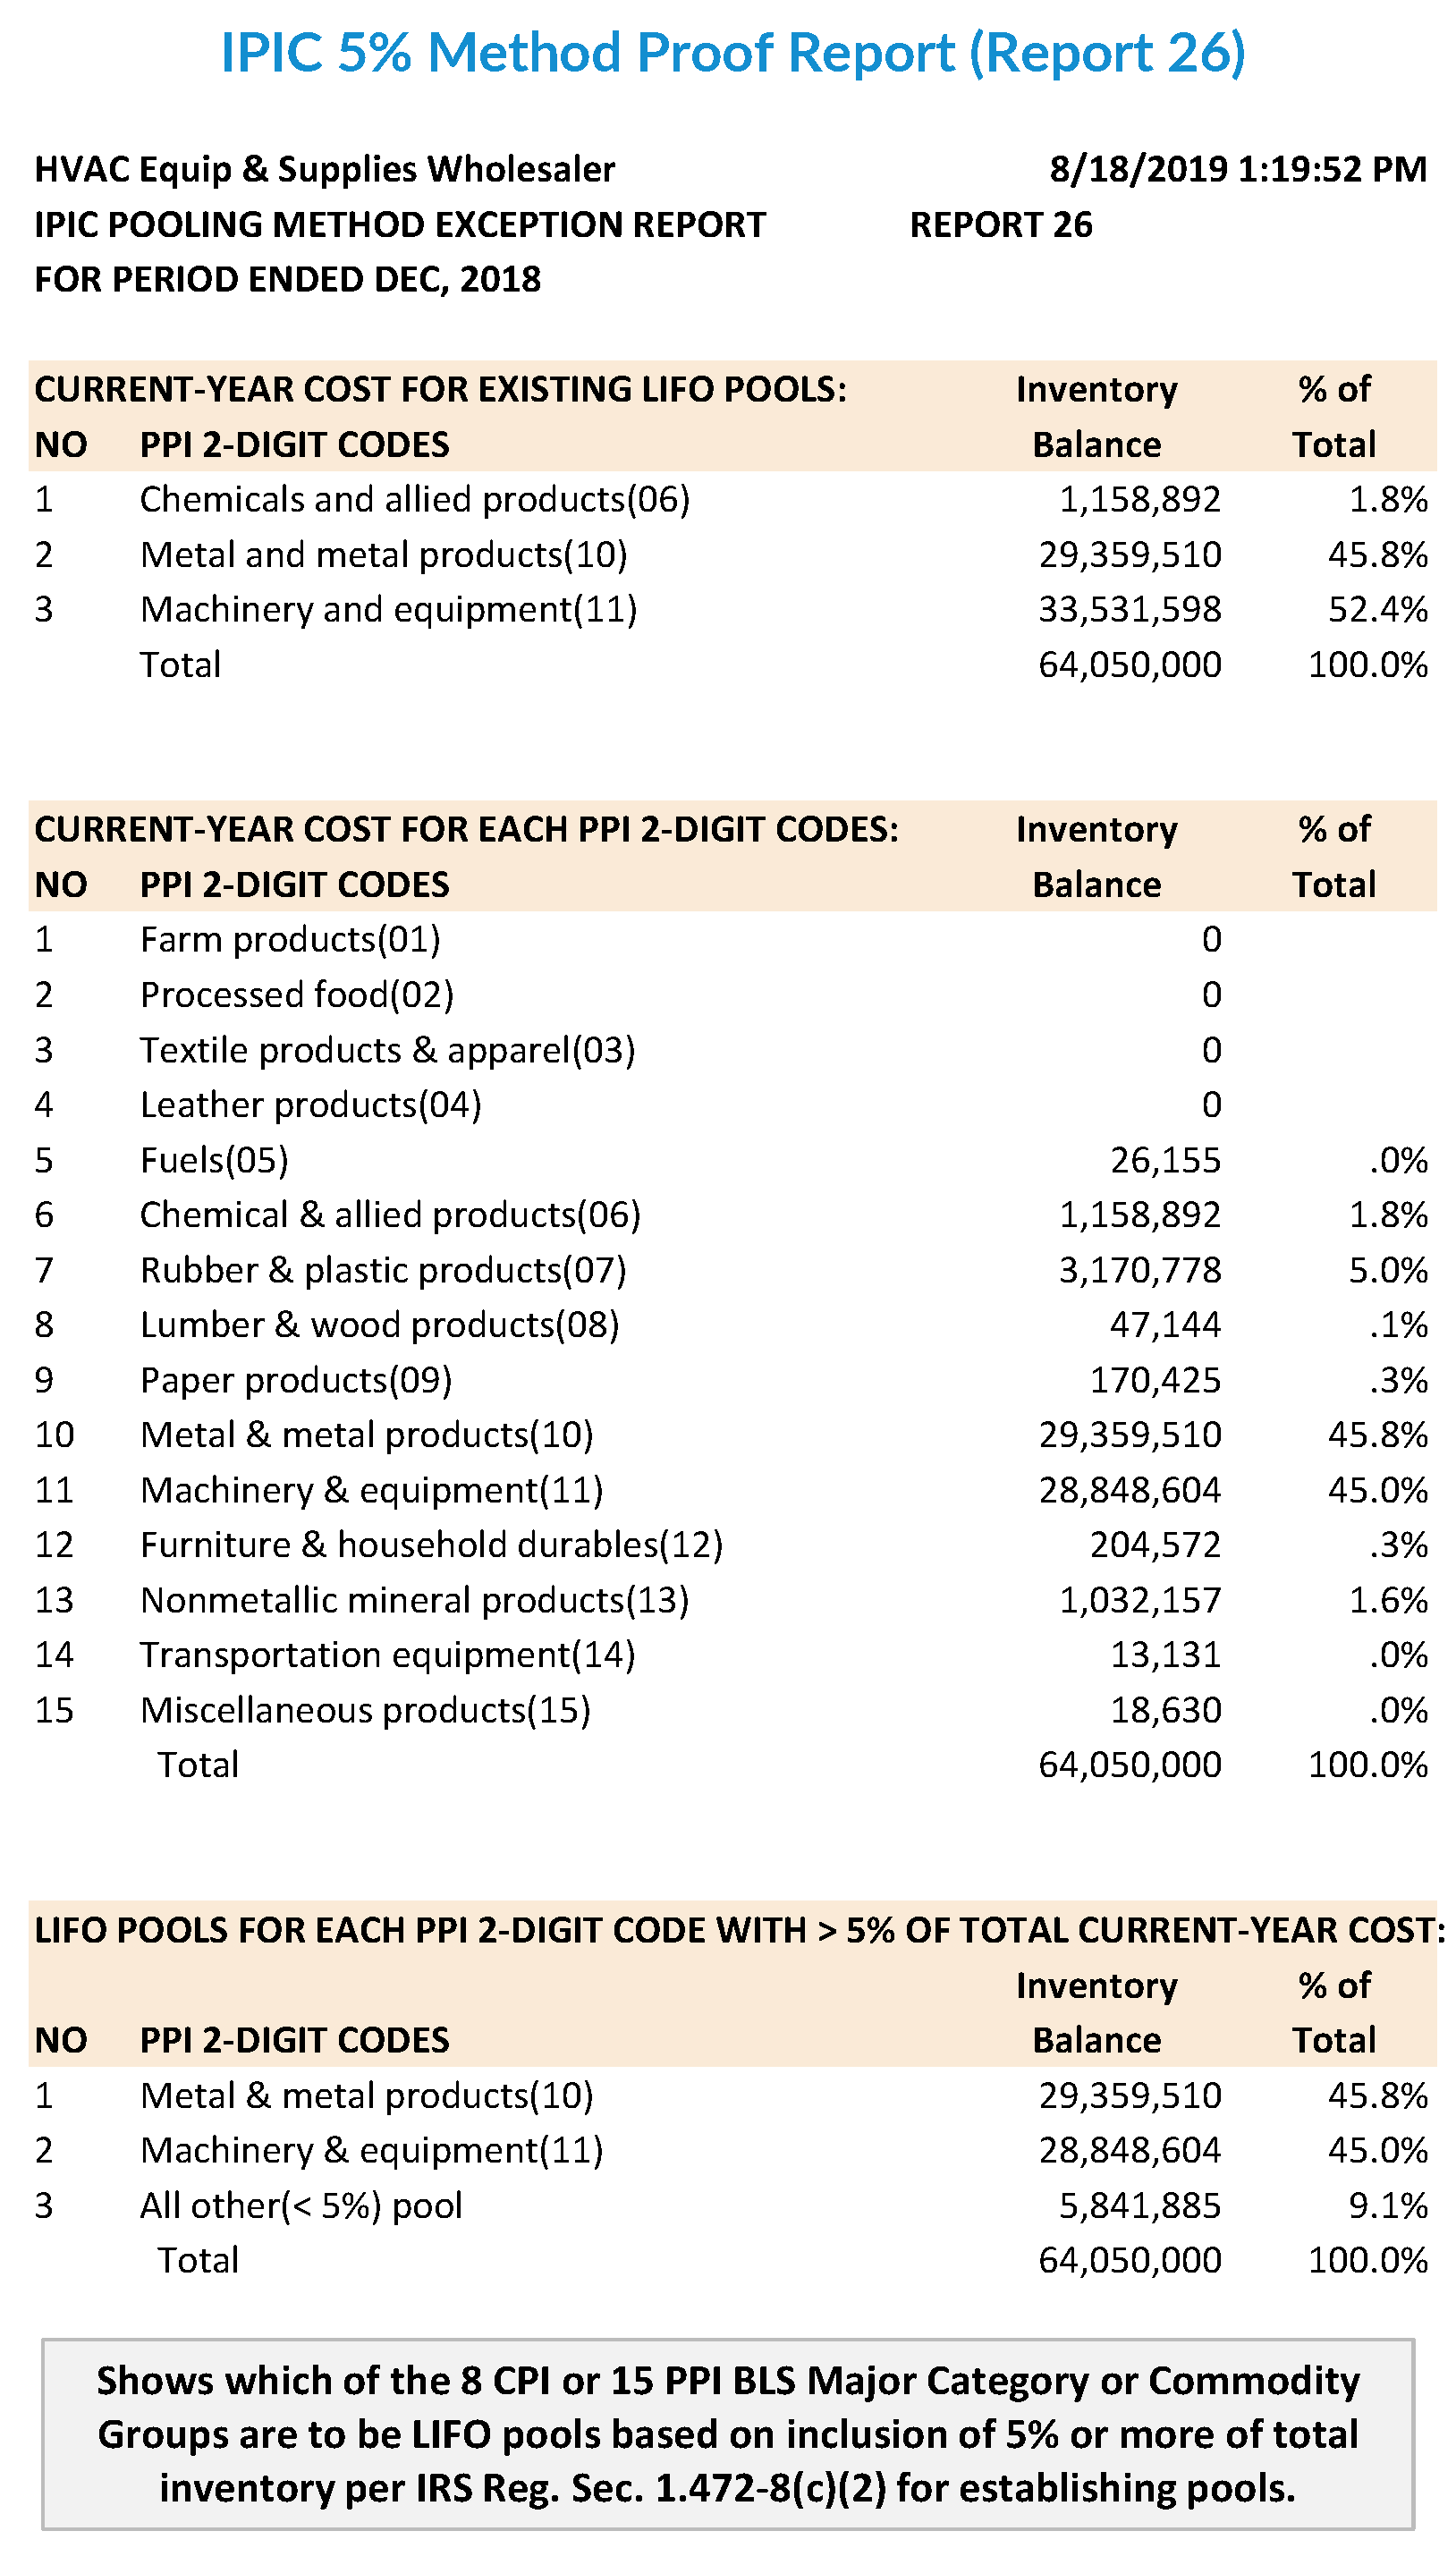
IPIC 5% Method Proof Report (Report 26) – Shows which of the 8 CPI or 15 PPI BLS Major Category or Commodity Groups are to be LIFO pools based on inclusion of 5% or more of total inventory per IRS Reg. Sec. 1.472-8(c)(2) for establishing pools.
IPIC Data Input Sheet Report – This report is the source document for external index calculations as it shows the Excel file imported into the software containing BLS categories & inventory balances.
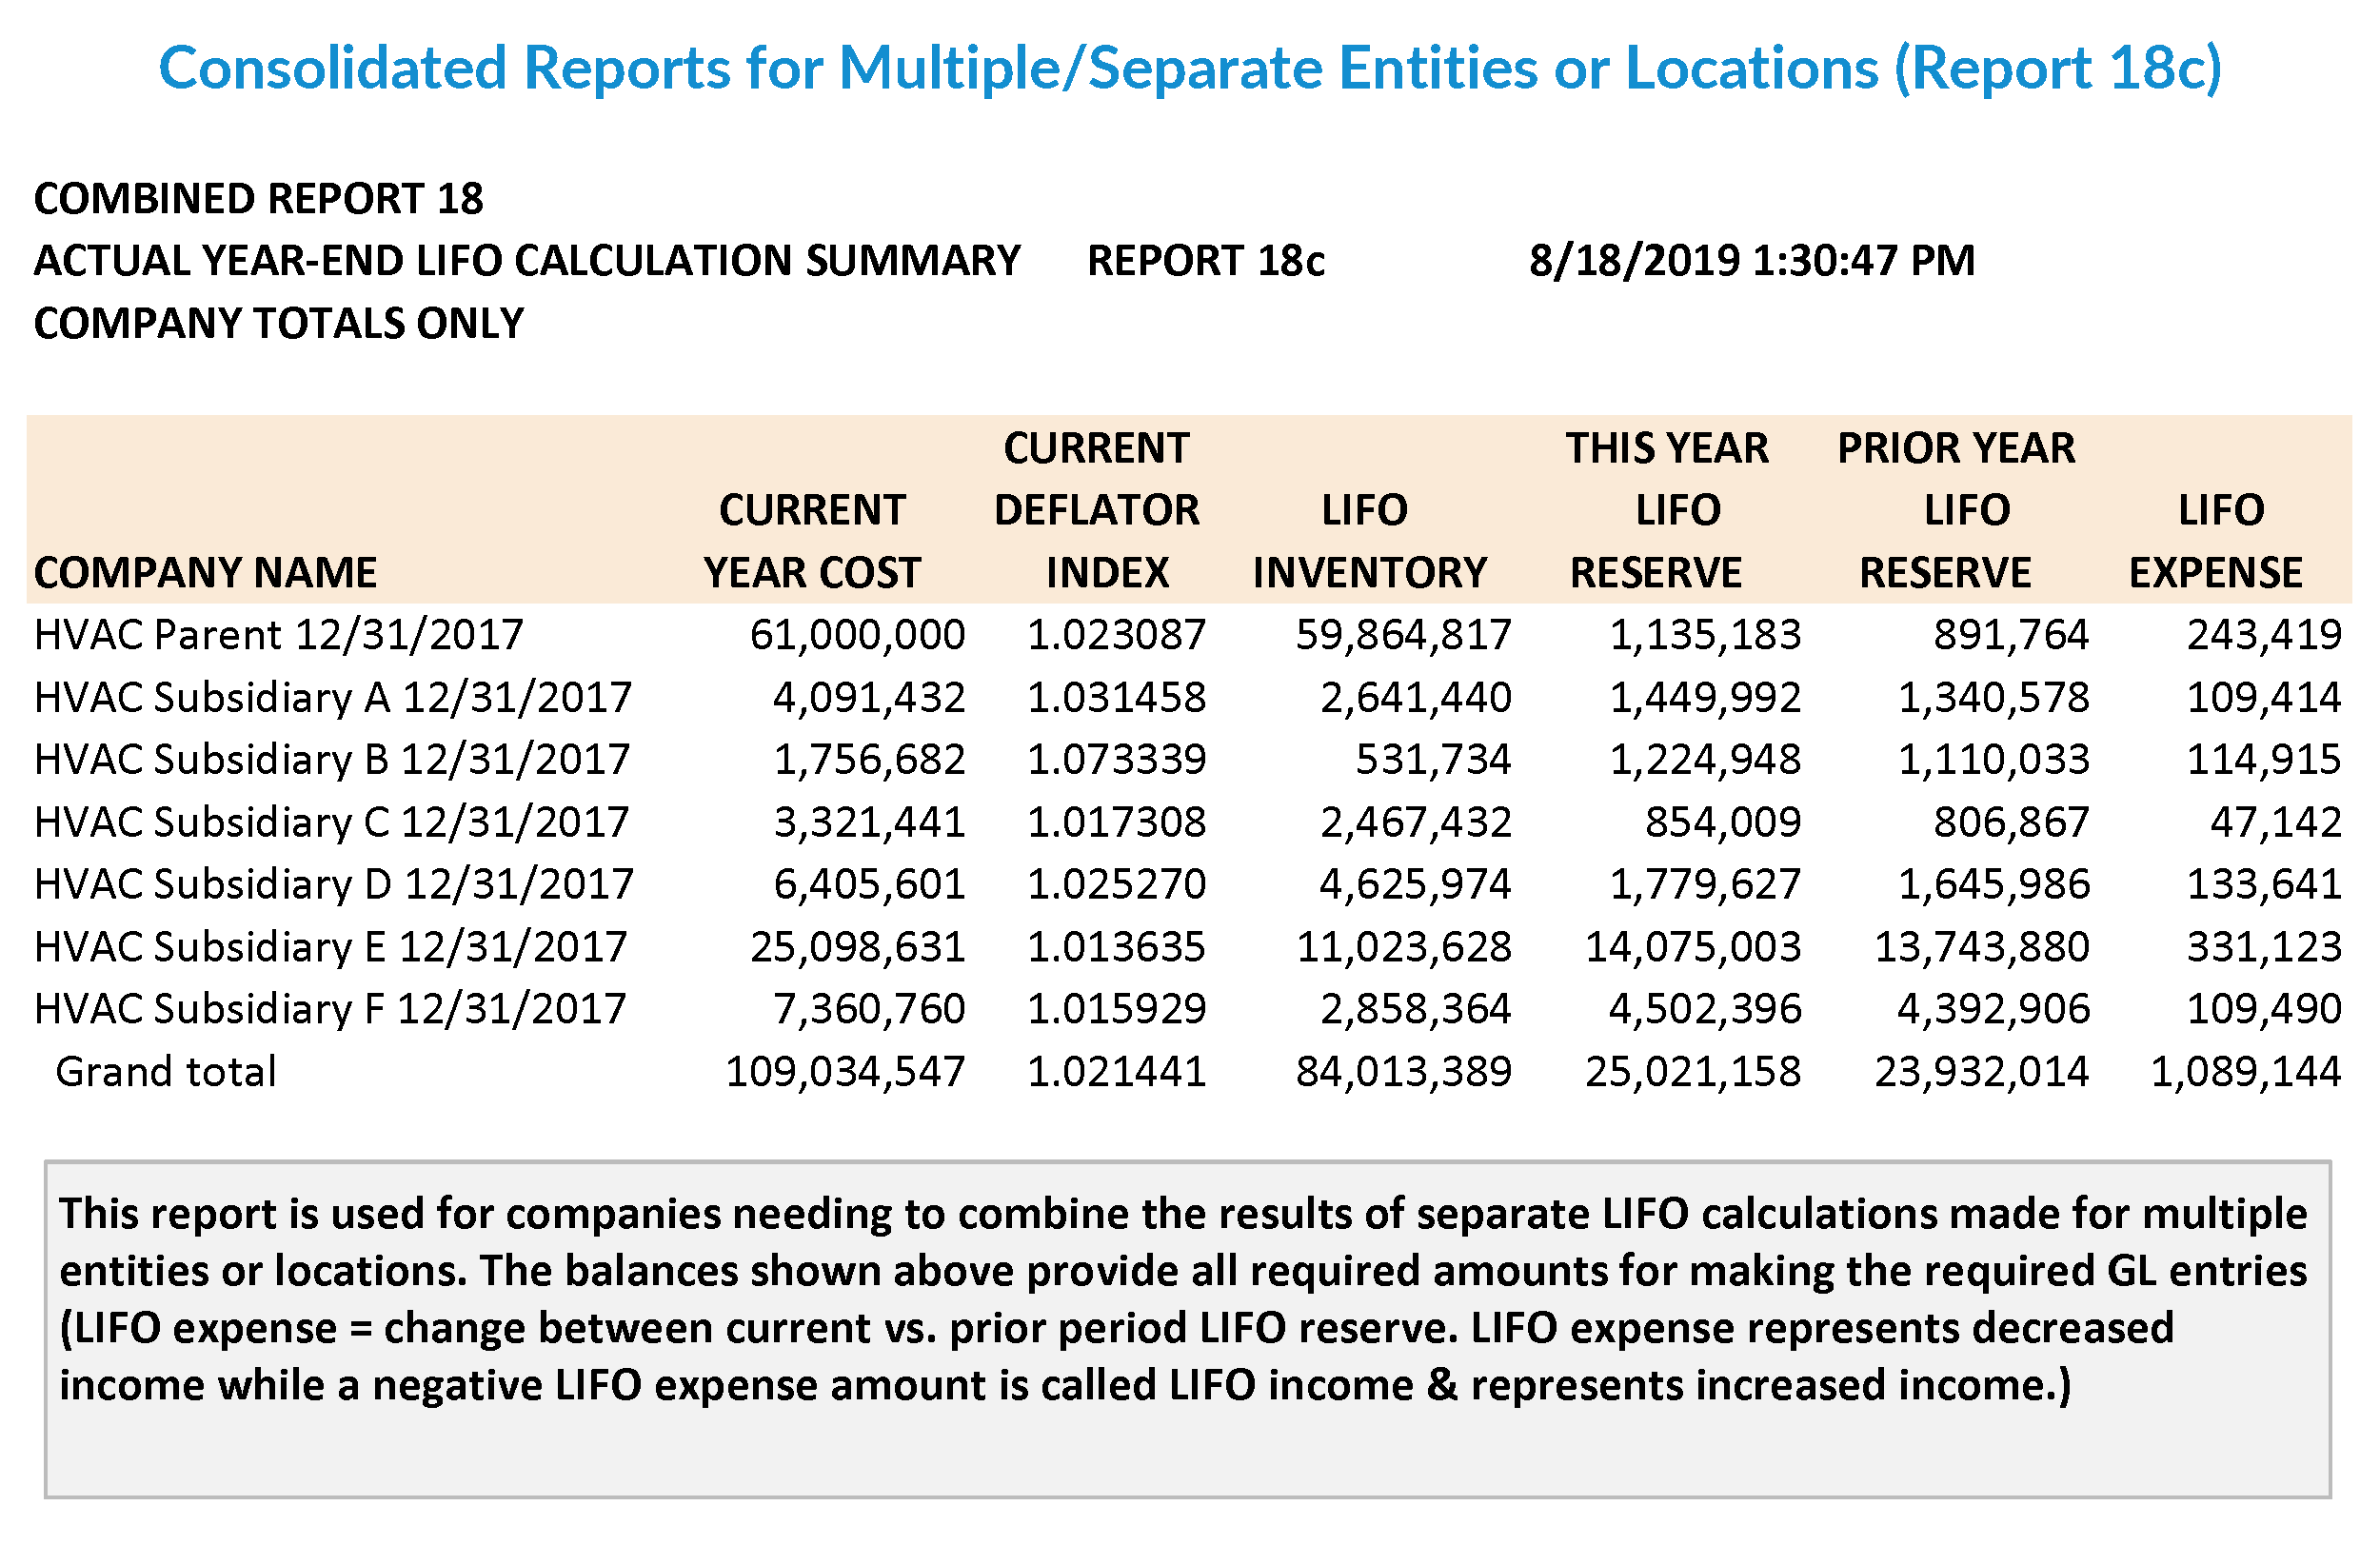
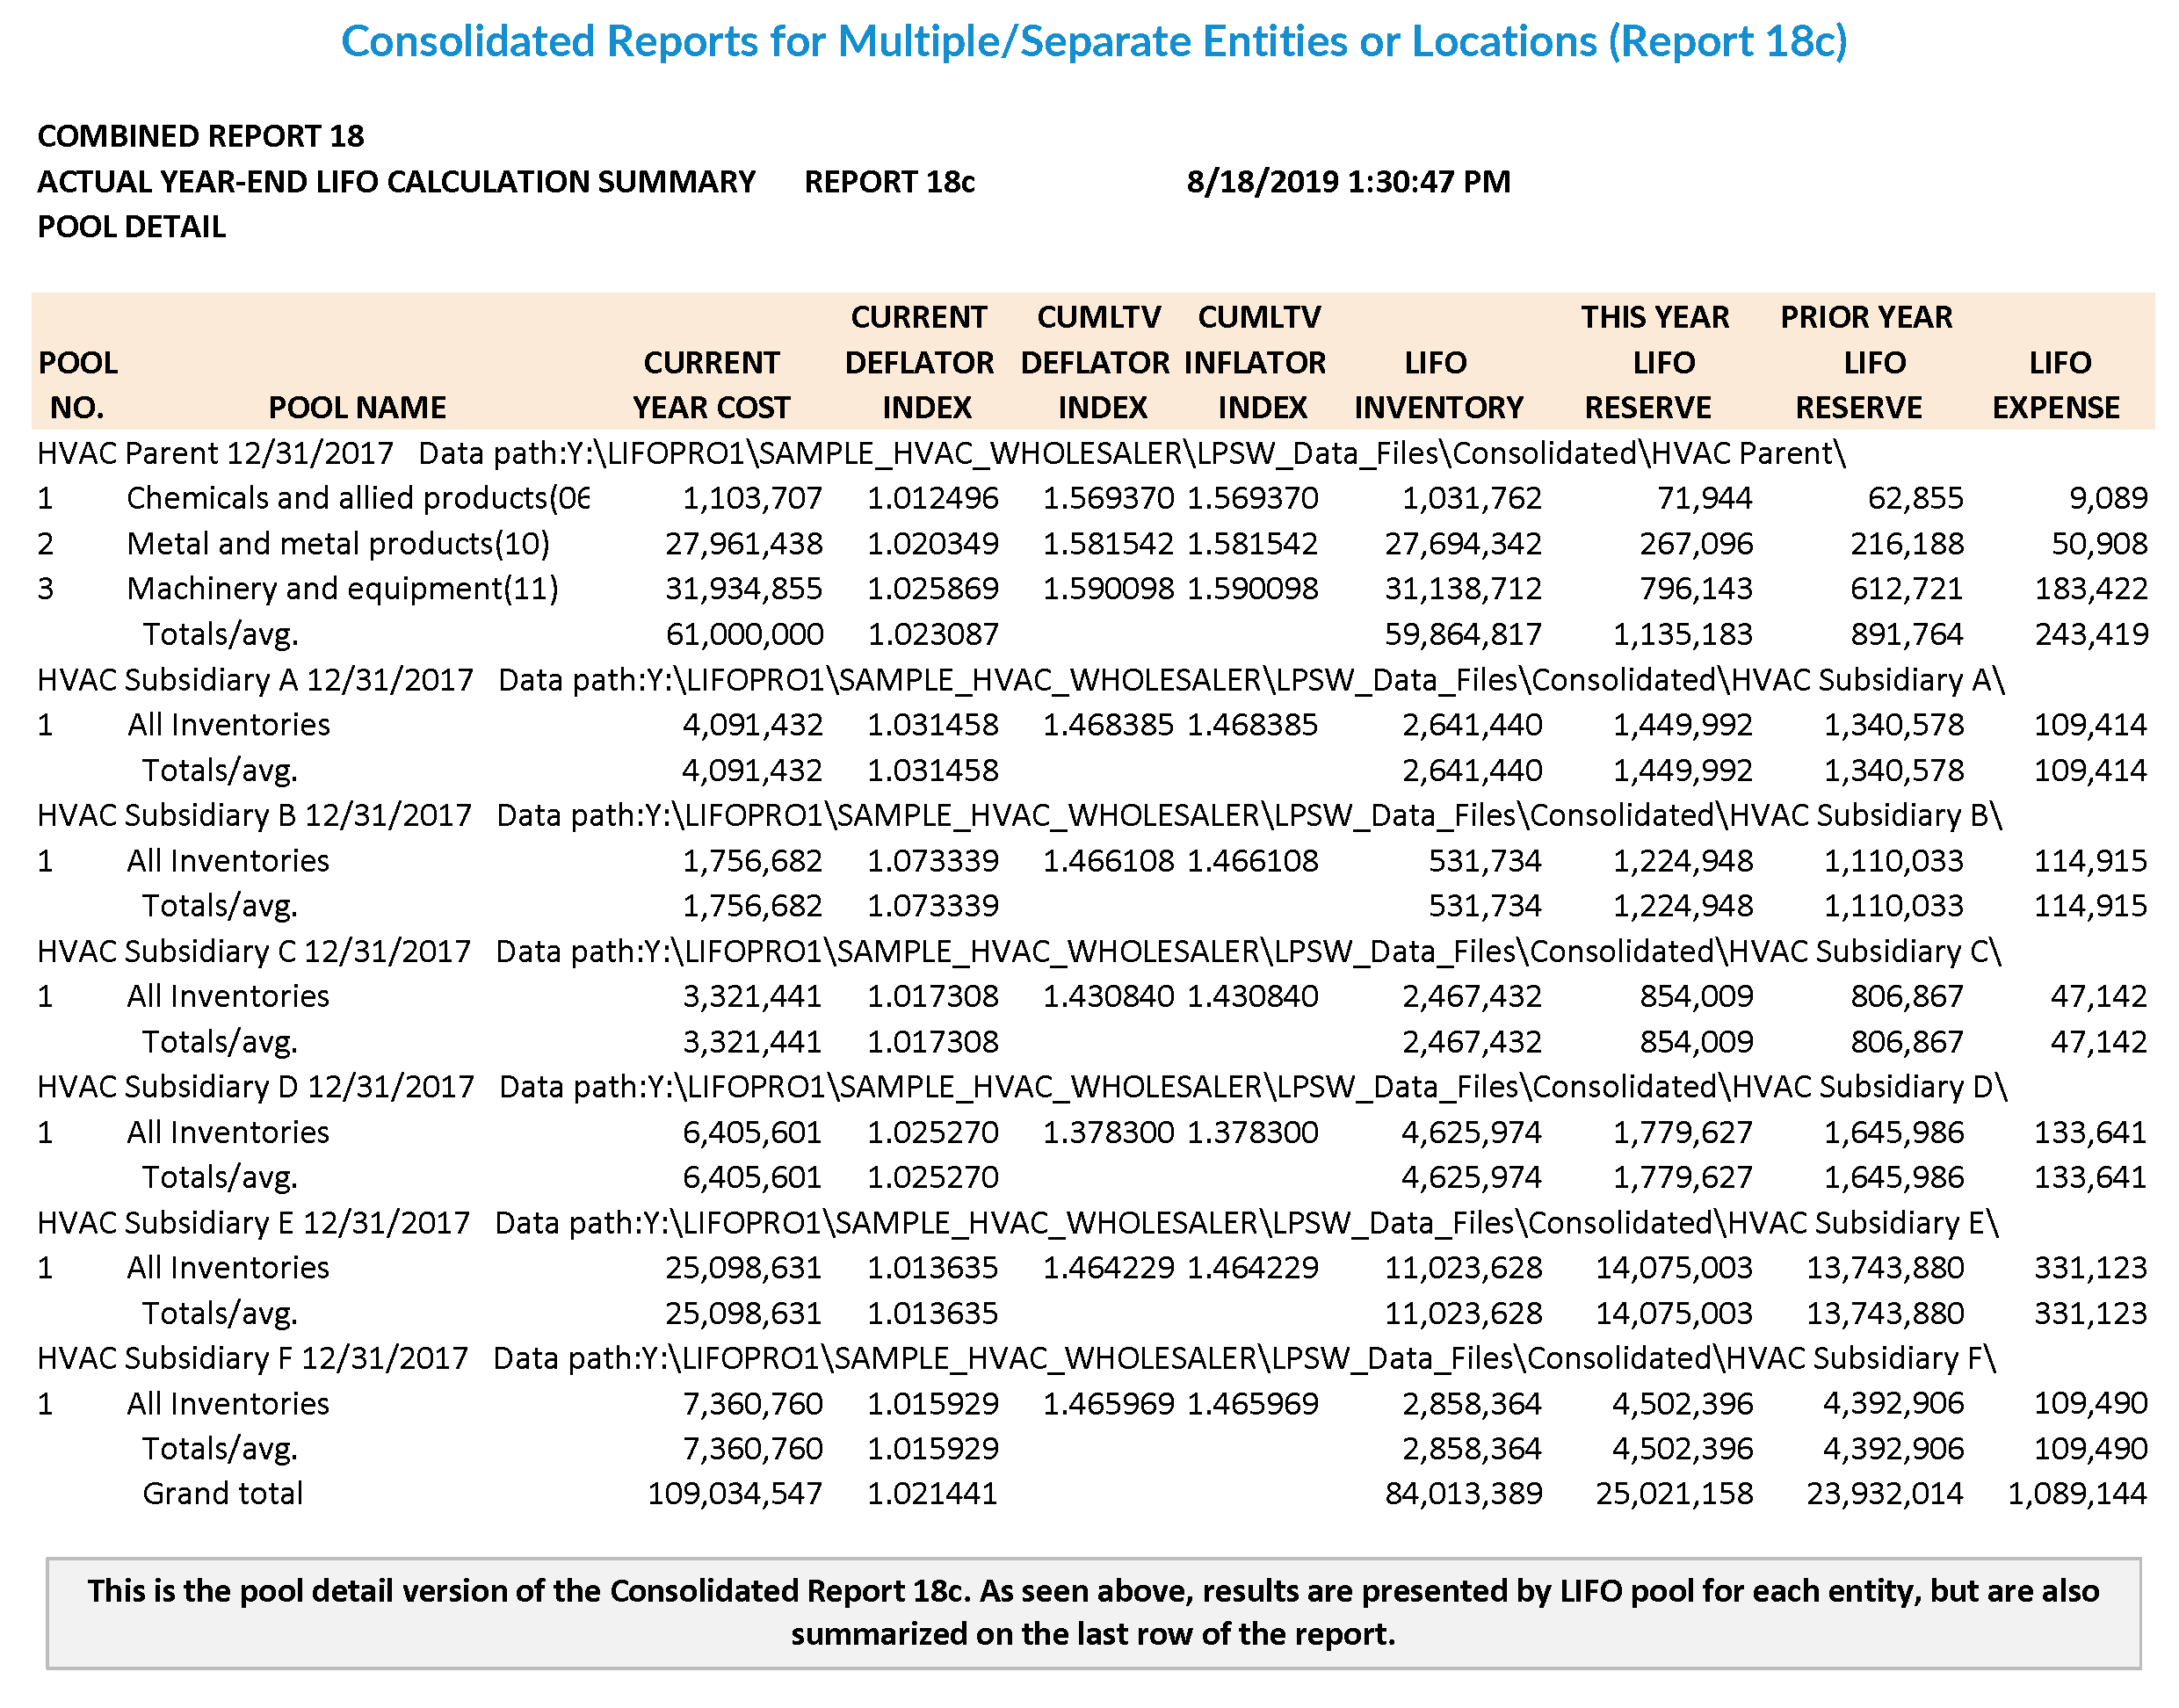
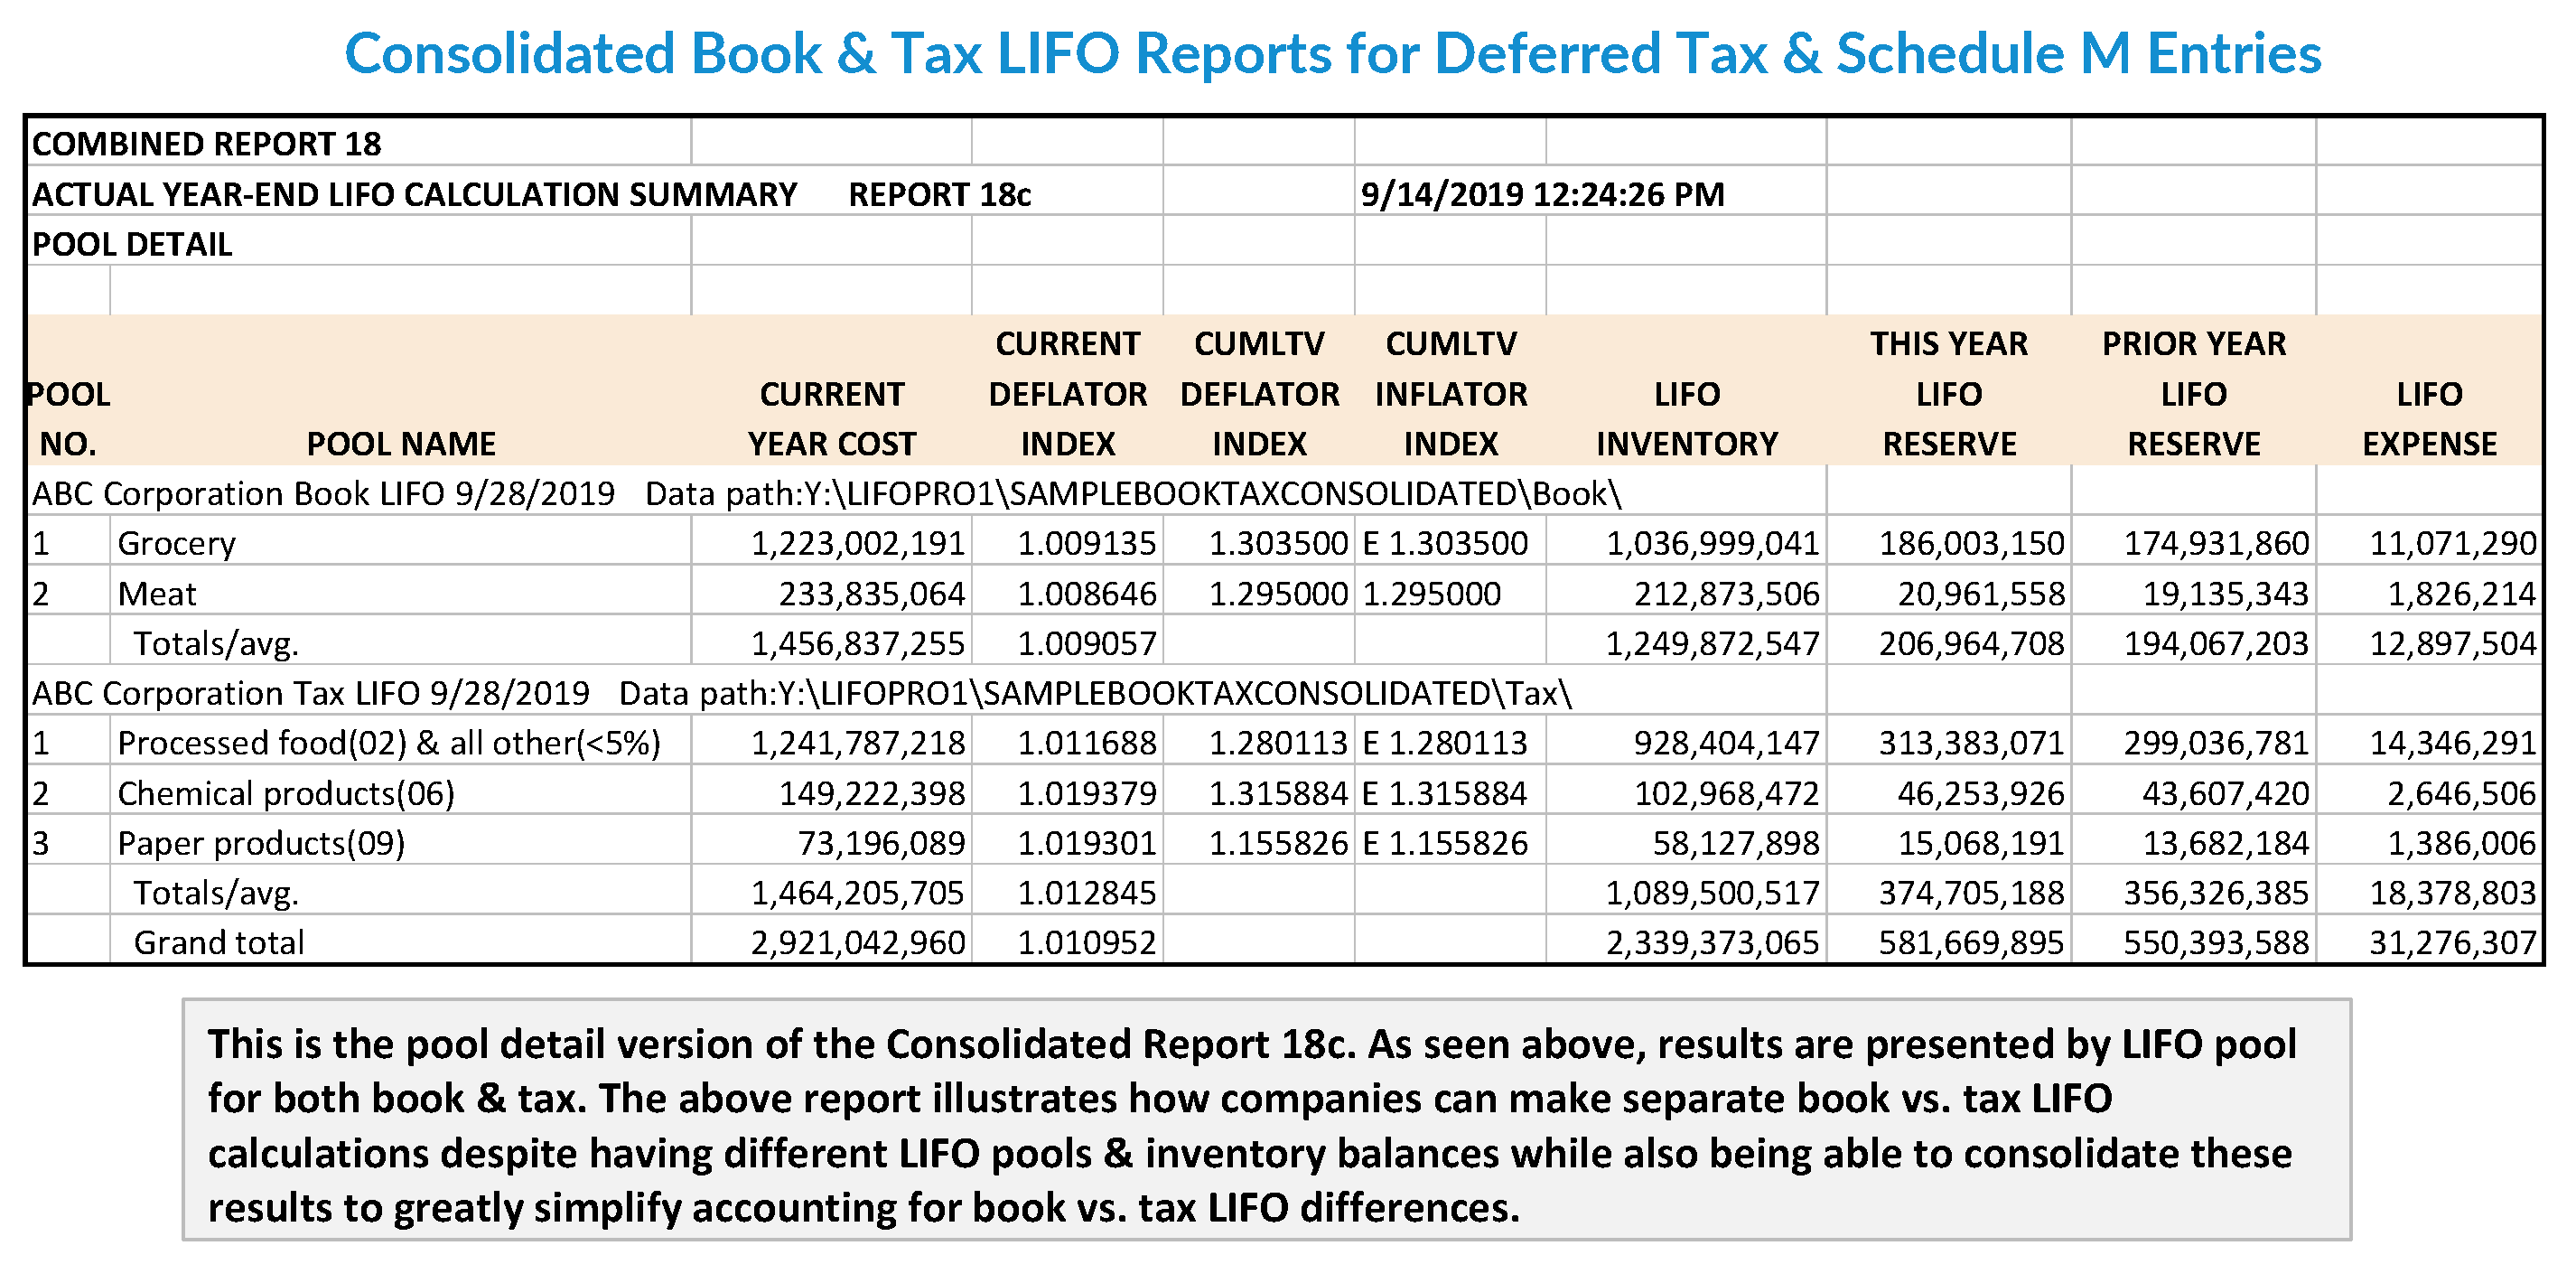
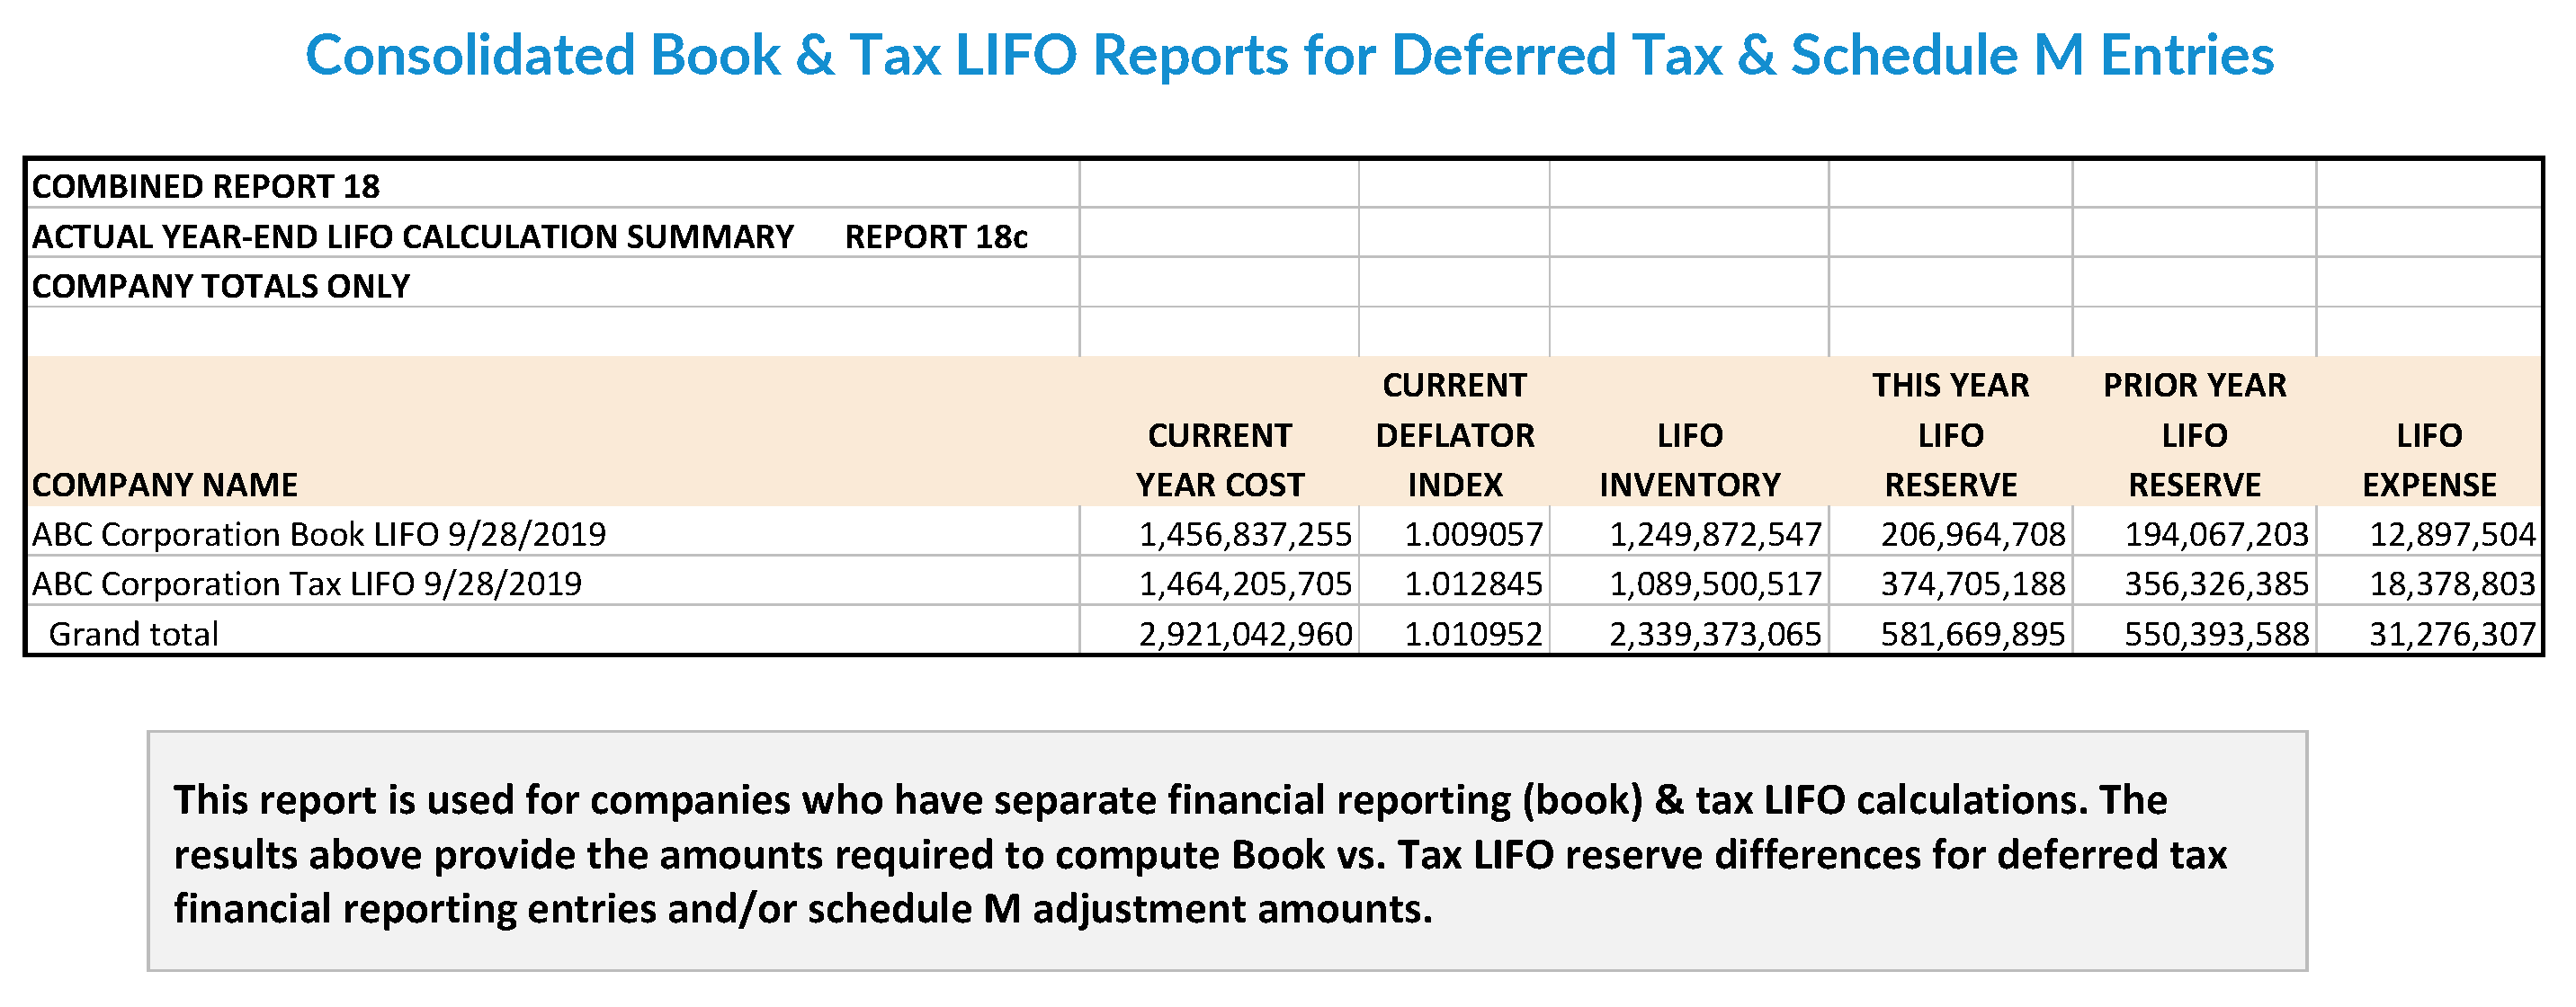
Consolidated Reports for Multiple/Separate Entities, Locations or for Differing Book & Tax LIFO Methods – Used for the following:
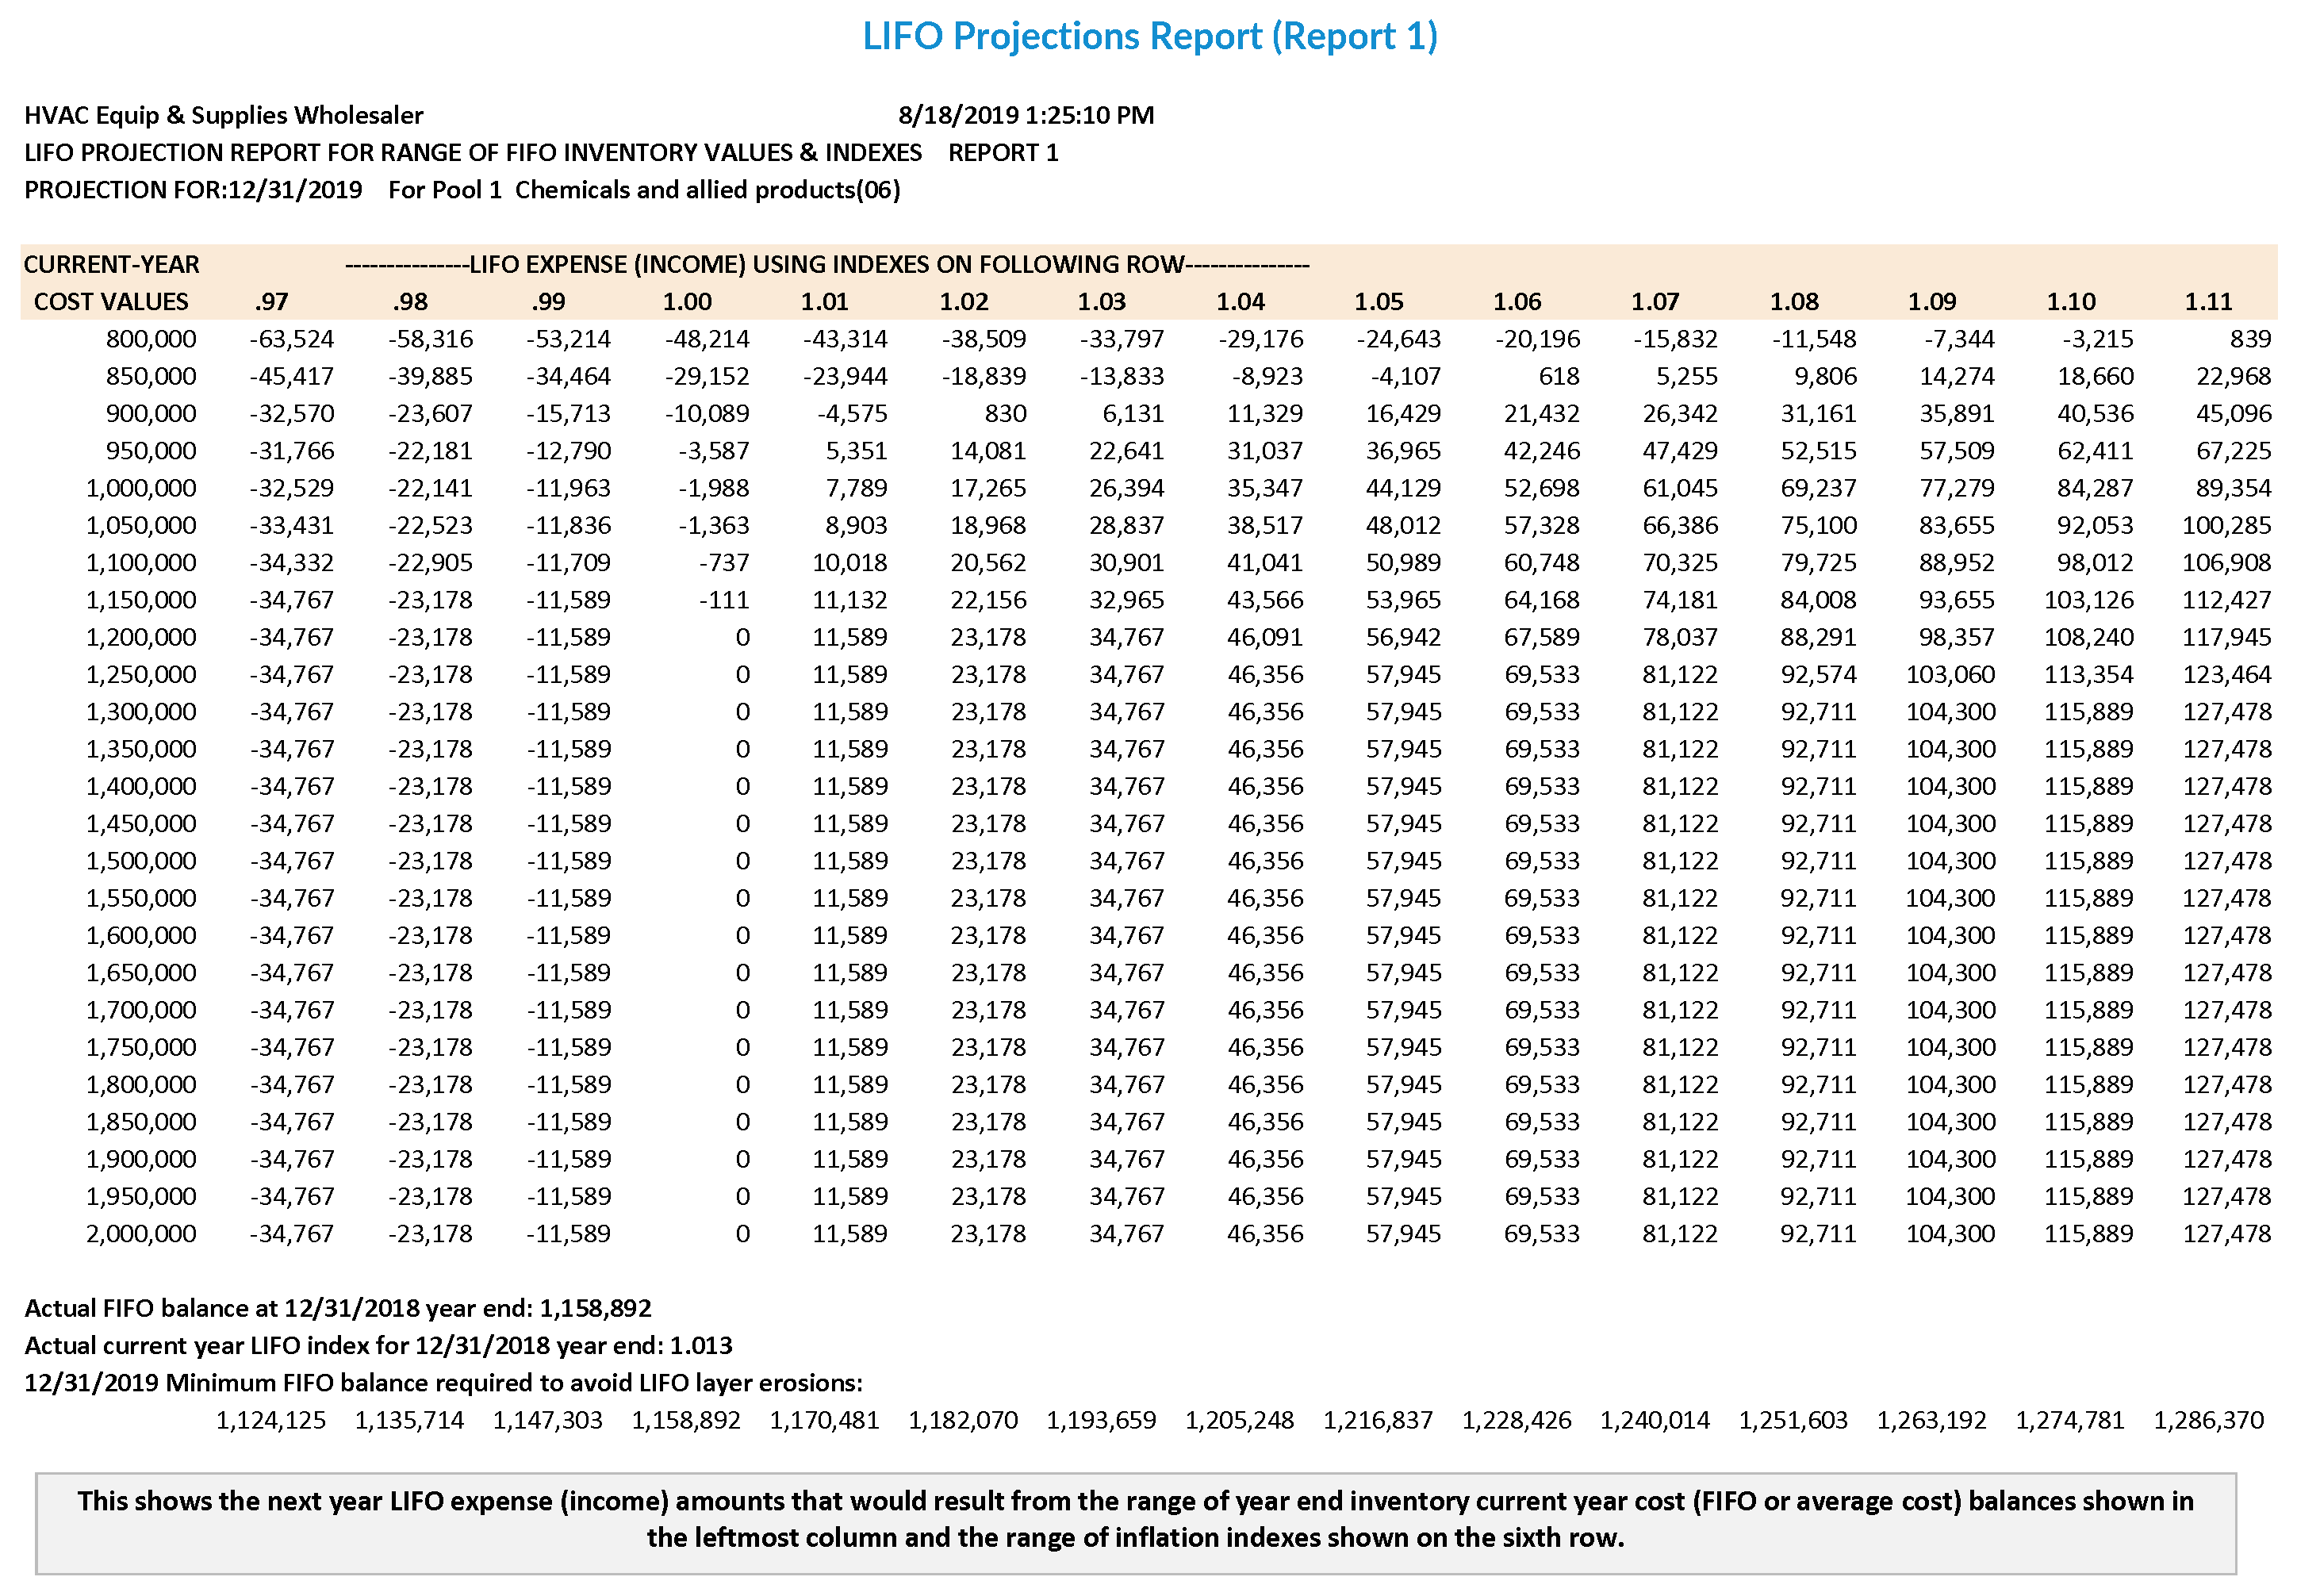
LIFO Projections Report (Report 1) – This shows the next year LIFO expense (income) amounts that would result from the range of year end inventory current year cost (FIFO or average cost) balances shown in the leftmost column and the range of inflation indexes shown on the sixth row.
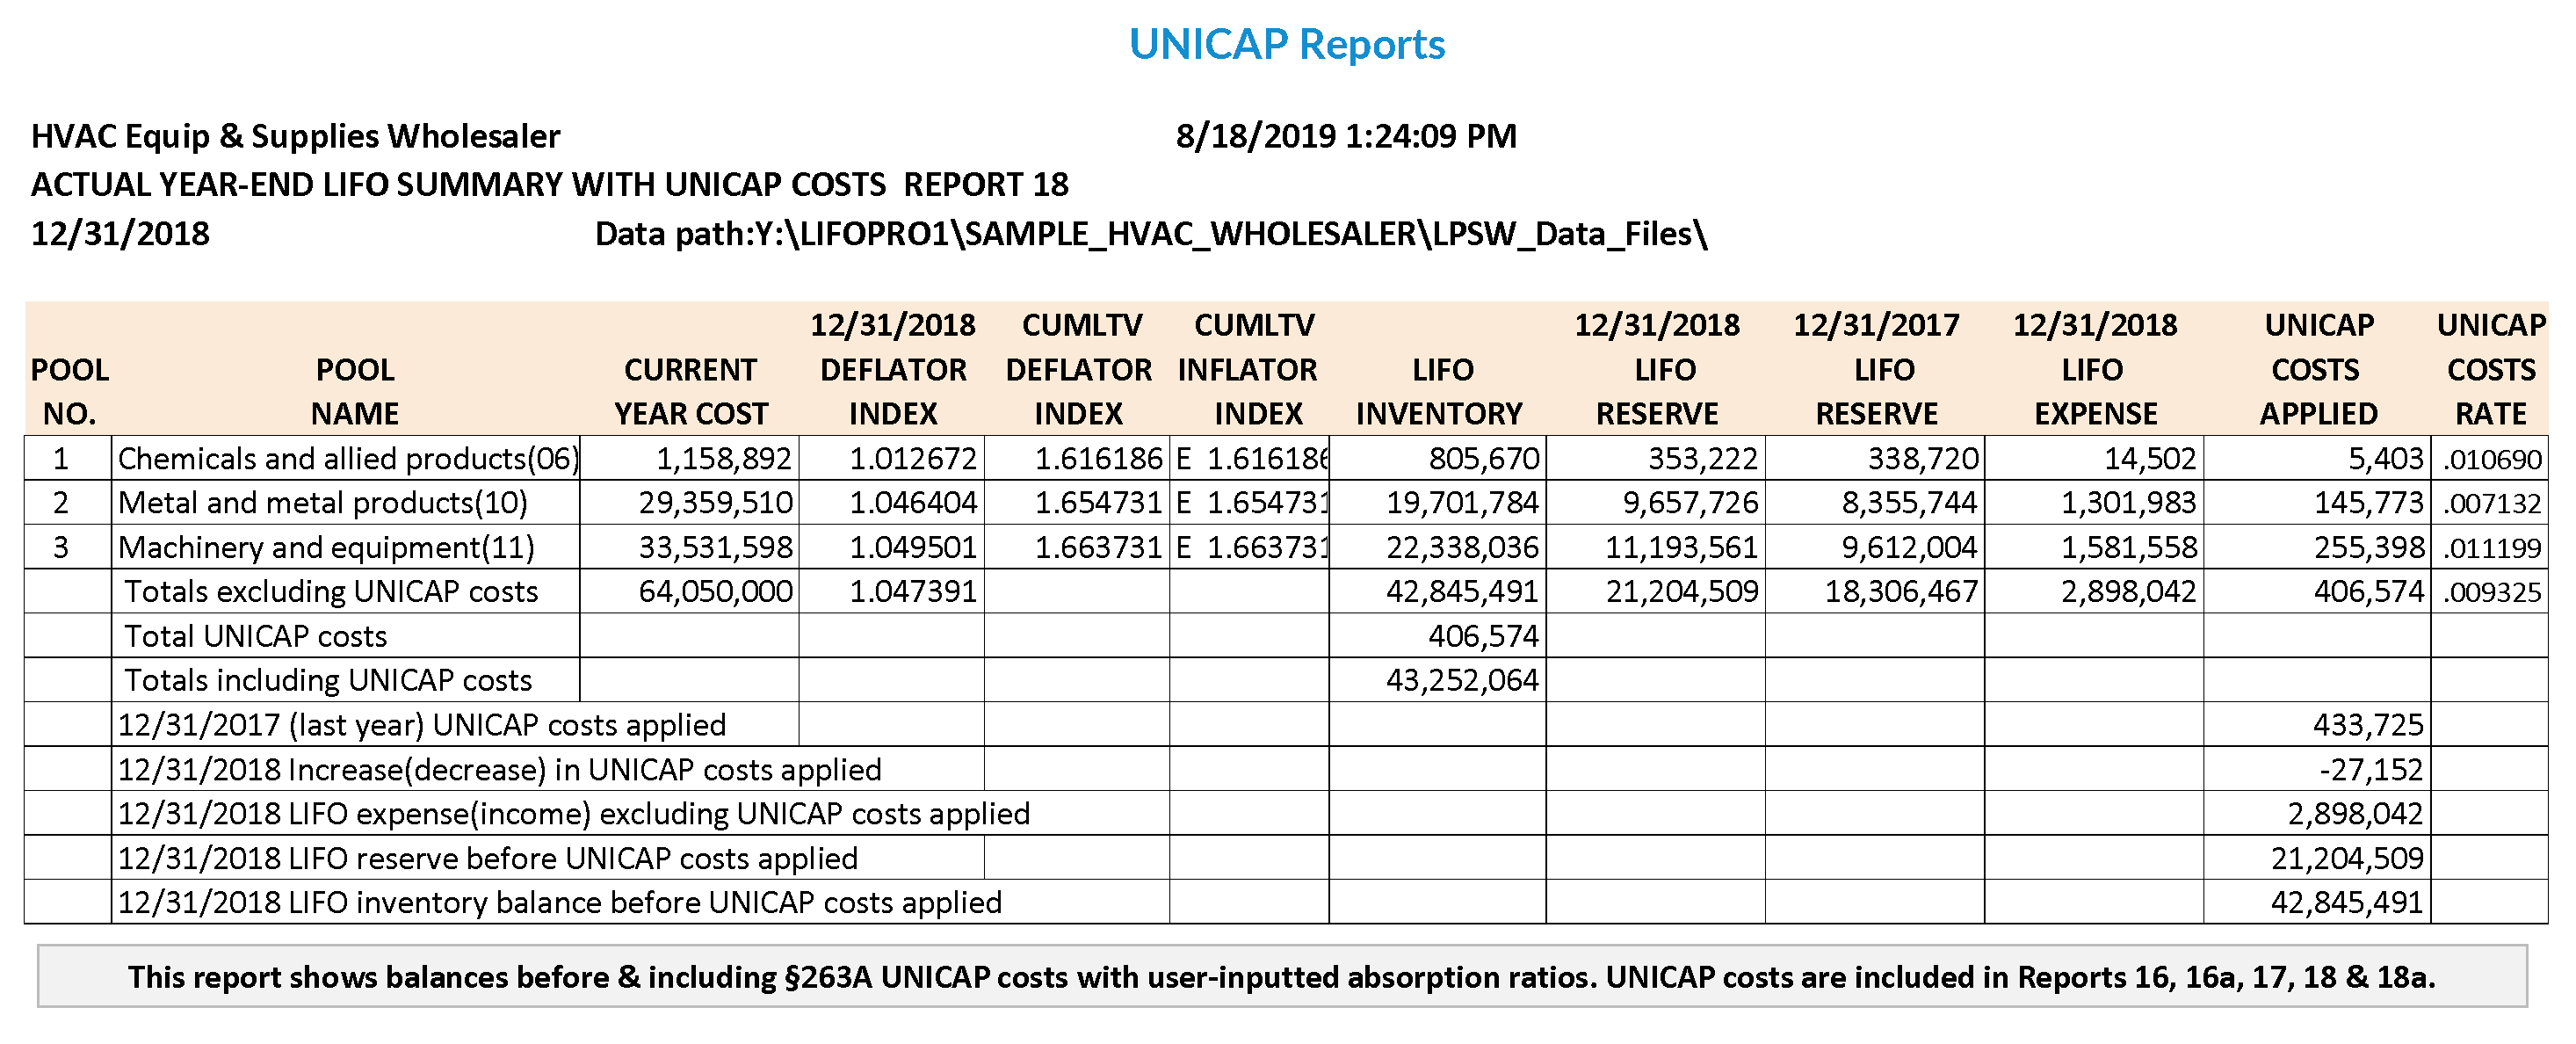
UNICAP Reports – Shows balances before & including §263A UNICAP costs with user-inputted absorption ratios. UNICAP costs are included in Reports 16, 16a, 17, 18 & 18a.

Trial the software for 90 days. Get a complimentary analysis for companies considering using LIFO. Get a complimentary review for companies on LIFO. Request a cost estimate. Use our simple form to submit your request.
Sign up today to receive industry news & promotional offers from LIFO-PRO