Expand the accordion tabs below to learn how to easily identify the best LIFO candidates!
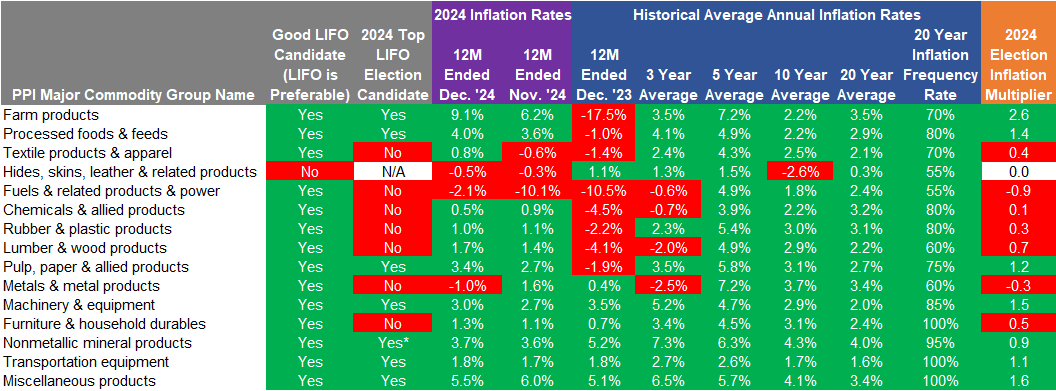
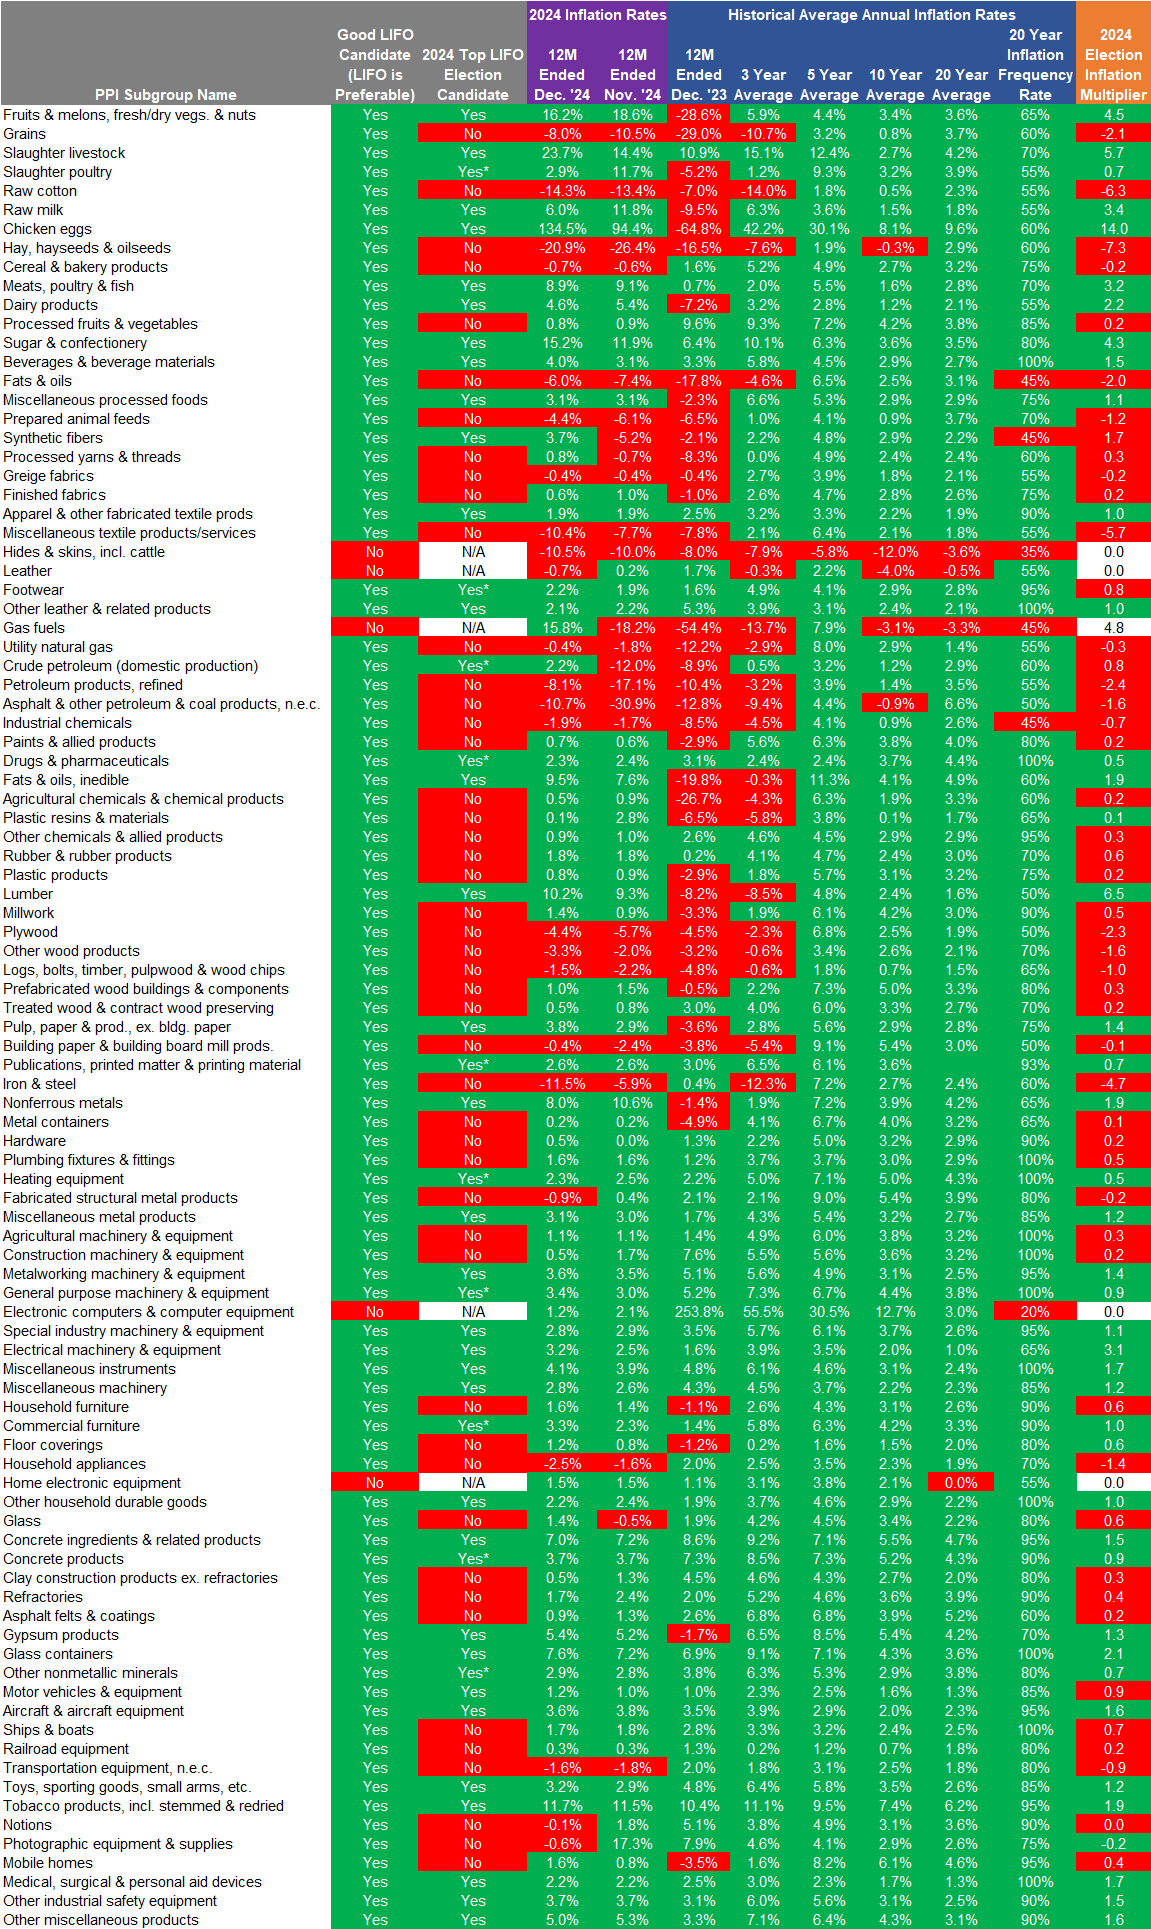
LIFOPro has developed a proprietary scoring system to identify good LIFO candidates & provide LIFO election recommendations, which requires for the following criteria to be met:
In the event that the following criteria listed above is met, a current year LIFO election recommendation is made if the current year inflation rate in the potential election year is greater than or equal to the historical average annual inflation rate calculated by LIFOPro
To recap, the following criteria should be met to make a LIFO election for your company’s upcoming year end:
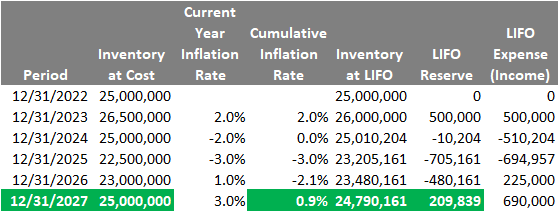
For companies with inflationary inventories, LIFO acts like an annuity that provides annual returns, and the long-term benefits can be substantial. Choosing the right time to start using LIFO will allow you to maximize the tax benefits that it provides.
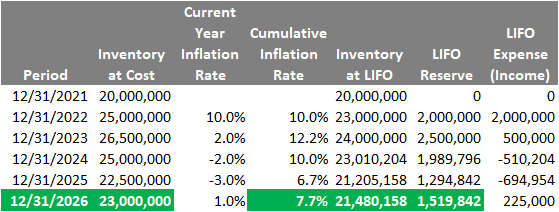
High Inflation Period – 10% inflation in election year (2022)
LIFO-PRO recommends using the following two-step approach to determine the potential benefits of LIFO for your company:
Use the following formulas to calculate the estimated LIFO tax savings that a company could achieve in the year of the LIFO election:
Example: To illustrate the use of the Quick Analysis LIFO Tax Savings Formula, assume the following:
Prior year end inventory balance at cost: $10M
Estimated current year inflation rate: 10%
Combined Federal/State Tax rate: 35%
Current year LIFO expense: $10M * 10% = $1M
Current year income tax reduction: $1M * 35% = $350K
Business or Industry Type | Count | Business or Industry Type | Count |
Machinery Manufacturing | 40 | Beverage and Tobacco Product Manufacturing | 7 |
Merchant Wholesalers, Durable Goods | 29 | Wood Product Manufacturing | 7 |
Chemical Manufacturing | 27 | Electrical Equip., Appliance & Component Mfg. | 7 |
Fabricated Metal Product Manufacturing | 26 | Textile & Textile Product Mills | 7 |
Petroleum and Coal Products Manufacturing | 23 | Plastics and Rubber Products Manufacturing | 6 |
Food Manufacturing | 21 | Printing and Related Support Activities | 6 |
Transportation Equipment Manufacturing | 18 | Clothing and Clothing Accessories Stores | 6 |
Merchant Wholesalers, Nondurable Goods | 17 | Publishing Industries (except Internet) | 6 |
Paper Manufacturing | 16 | Steel Pipe And Tubes | 5 |
Primary Metal Manufacturing | 13 | Leather and Allied Product Manufacturing | 4 |
Miscellaneous Retailers | 13 | Mining (except Oil and Gas) | 4 |
Food and Beverage Stores | 12 | Miscellaneous Manufacturing | 4 |
General Merchandise Stores | 10 | Apparel Manufacturing | 4 |
Motor Vehicle and Parts Dealers | 9 | Nonmetallic Mineral Product Manufacturing | 3 |
Furniture and Related Product Manufacturing | 8 | Furniture and Home Furnishings Stores | 3 |
Computer and Electronic Product Manufacturing | 8 | Health and Personal Care Stores | 3 |
Primary Business Activity or Product | Primary Business Activity or Product |
Auto and Home Supply Stores | Industrial Supplies |
Beer and Ale | Industrial Trucks, Tractors, Trailers & Stackers |
Beverage and Tobacco Product Manufacturing | Industrial Valves |
Bolts, Nuts, Screws, Rivets & Washers | Laboratory Apparatus and Furniture |
Building Material and Garden Equipment and Supplies Dealers | Lighting Equipment |
Chemical Manufacturing | Lumber and Other Building Materials Dealers |
Department Stores | Machinery Manufacturing |
Drugs, Drug Proprietaries & Druggists’ Sundries | Metals Service Centers |
Durable and Non-Durable Goods Wholesalers | Construction Machinery & Heavy Duty Equipment |
Electrical Machinery, Equipment & Supplies | Navigation, Measuring, Medical & Control Instruments |
Electrical Machinery, Equipment, Appliance & Component Mfg. | Nonmetallic Mineral Product Manufacturing |
Fabricated Metal Product Manufacturing | Paper Manufacturing |
Fabricated Pipe and Pipe Fittings | Petroleum and Coal Products Manufacturing |
Fabricated Plate Work (Boiler Shops) | Plastics and Rubber Products Manufacturing |
Fabricated Structural Metal | Plastics Foam Products |
Farm and Garden Machinery and Equipment | Plastics Material Synthetic Resins & Nonvulcanizable Elastomers |
Farm Supplies | Plastics Materials and Basic Forms and Shapes |
Food and Beverage Stores | Plumbing and Heating Equipment and Supplies (Hydronics) |
Food Manufacturing | Power, Distribution & Specialty Transformers |
Furniture and Home Furnishings Stores | Primary Metal Manufacturing |
Furniture and Related Product Manufacturing | Publishing Industries (except Internet) |
Gaskets, Packing & Sealing Devices | Pumps and Pumping Equipment |
Gasoline Stations | Recreational Vehicle Dealers |
General Industrial Machinery and Equipment | Steel Works, Blast Furnaces (Inc. Coke Ovens) & Rolling Mills |
General Merchandise Stores | Tobacco and Tobacco Products |
Hand and Edge Tools, Except Machine Tools and Handsaws | Transportation Equipment Manufacturing |
Hardware Stores | Variety Stores |
Health and Personal Care Stores | Warm Air Heating and Air-Conditioning Equipment and Supplies |
Industrial & Commercial Fans & Blowers & Air Purification Equipment | Wines, Brandy & Brandy Spirits |
Industrial Machinery and Equipment | Wood Product Manufacturing |
BLS PPI Code | BLS PPI Commodity Description | 9M Ended Sep. '22 (YTD) | 12M Ended Sep. '22 | 12M Ended Dec. '21 | 12M Ended Dec. '20 | 3 Year Annual Avg. | 5 Year Annual Avg. | 10 Year Annual Avg. | 20 Year Annual Avg. | Inflation Freq-uency | Infl-ation Freq. Rate | YTD vs. 20Y Average Multiplier |
---|---|---|---|---|---|---|---|---|---|---|---|---|
02 | Processed foods & feeds | 10.2% | 9.7% | 10.4% | 2.0% | 4.9% | 3.2% | 1.7% | 2.8% | 17 of 20 | 85% | 3.6 |
021 | Cereal & bakery products | 12.9% | 15.6% | 9.2% | 0.1% | 3.2% | 2.7% | 1.5% | 2.8% | 16 of 20 | 80% | 4.6 |
022 | Meats, poultry & fish | 3.8% | -2.3% | 20.0% | 2.7% | 9.2% | 4.8% | 2.7% | 3.3% | 14 of 20 | 70% | 1.2 |
023 | Dairy products | 13.2% | 18.0% | 7.6% | -3.0% | 4.0% | 1.9% | 1.0% | 2.2% | 11 of 20 | 55% | 6.0 |
024 | Processed fruits & vegetables | 14.3% | 16.3% | 4.5% | 3.8% | 2.4% | 2.4% | 1.7% | 2.7% | 17 of 20 | 85% | 5.2 |
025 | Sugar & confectionery | 8.6% | 9.4% | 3.1% | -1.4% | 1.7% | 1.2% | 0.5% | 2.6% | 16 of 20 | 80% | 3.3 |
026 | Beverages & beverage materials | 8.6% | 10.4% | 3.3% | 2.1% | 2.3% | 1.9% | 1.4% | 2.1% | 20 of 20 | 100% | 4.1 |
027 | Fats & oils | 10.5% | 11.8% | 42.5% | 10.8% | 14.7% | 8.3% | 1.9% | 6.3% | 11 of 20 | 55% | 1.7 |
028 | Miscellaneous processed foods | 14.6% | 16.9% | 5.9% | 1.2% | 2.0% | 2.4% | 1.6% | 2.2% | 16 of 20 | 80% | 6.7 |
029 | Prepared animal feeds | 17.1% | 15.9% | 8.0% | 9.6% | 5.9% | 3.9% | 1.4% | 3.9% | 15 of 20 | 75% | 4.4 |
03 | Textile products & apparel | 8.7% | 12.9% | 15.4% | -0.2% | 4.7% | 3.8% | 1.9% | 1.8% | 13 of 20 | 65% | 4.8 |
032 | Processed yarns & threads | 17.9% | 27.1% | 29.3% | -2.0% | 6.7% | 5.8% | 1.8% | 2.7% | 13 of 20 | 65% | 6.5 |
033 | Greige fabrics | 11.7% | 15.3% | 13.3% | -1.1% | 3.2% | 2.6% | 0.3% | 1.6% | 11 of 20 | 55% | 7.1 |
034 | Finished fabrics | 9.1% | 12.1% | 14.5% | 1.8% | 5.7% | 4.1% | 2.3% | 2.2% | 14 of 20 | 70% | 4.1 |
038 | Apparel & other fabricated textile prods | 4.2% | 7.3% | 7.0% | -0.1% | 2.7% | 2.2% | 1.8% | 1.4% | 16 of 20 | 80% | 3.1 |
039 | Miscellaneous textile products/services | 26.1% | 37.5% | 25.7% | 2.2% | 5.2% | 3.7% | 1.7% | 1.8% | 12 of 20 | 60% | 14.5 |
043 | Footwear | 6.6% | 10.0% | 6.0% | -0.2% | 3.0% | 2.3% | 2.7% | 2.1% | 18 of 20 | 90% | 3.1 |
044 | Other leather & related products | 4.0% | 5.0% | 3.0% | 1.1% | 1.8% | 1.7% | 2.1% | 1.6% | 19 of 20 | 95% | 2.5 |
05 | Fuels & related products & power | 33.8% | 36.6% | 38.3% | -6.3% | 6.7% | 6.9% | 0.2% | 4.9% | 13 of 20 | 65% | 6.8 |
053 | Gas fuels | 72.8% | 93.5% | 108.2% | 9.1% | 1.3% | 7.8% | 0.5% | 4.6% | 11 of 20 | 55% | 15.8 |
055 | Utility natural gas | 8.7% | 33.7% | 40.5% | 14.5% | 9.0% | 9.3% | 4.5% | 4.4% | 13 of 20 | 65% | 2.0 |
056 | Crude petroleum (domestic production) | 33.0% | 31.1% | 48.6% | -22.3% | 9.2% | 6.0% | -3.9% | 7.7% | 13 of 20 | 65% | 4.3 |
057 | Petroleum products, refined | 39.5% | 40.6% | 57.4% | -15.3% | 11.8% | 10.8% | -1.0% | 7.7% | 13 of 20 | 65% | 5.1 |
058 | Asphalt & other petroleum & coal products | 19.4% | 44.1% | 48.7% | 11.9% | 8.7% | 15.2% | -1.9% | 9.0% | 12 of 20 | 60% | 2.2 |
06 | Chemicals & allied products | 5.5% | 6.4% | 22.9% | 0.7% | 6.4% | 5.5% | 2.6% | 4.5% | 17 of 20 | 85% | 1.2 |
061 | Industrial chemicals | 5.7% | 4.1% | 44.5% | -3.1% | 9.3% | 7.3% | 0.9% | 5.3% | 12 of 20 | 60% | 1.1 |
062 | Paints & allied products | 17.9% | 21.4% | 13.9% | 1.4% | 6.0% | 5.1% | 2.7% | 3.9% | 17 of 20 | 85% | 4.6 |
064 | Fats & oils, inedible | 16.0% | 8.0% | 49.7% | 15.2% | 21.3% | 8.3% | 0.5% | 7.4% | 12 of 20 | 60% | 2.2 |
065 | Agricultural chemicals & chemical products | 14.6% | 30.8% | 49.5% | 3.8% | 12.5% | 10.2% | 2.4% | 5.1% | 13 of 20 | 65% | 2.9 |
067 | Other chemicals & allied products | 9.7% | 13.4% | 8.7% | 0.3% | 3.3% | 2.8% | 1.9% | 2.4% | 19 of 20 | 95% | 4.0 |
07 | Rubber & plastic products | 9.2% | 14.3% | 21.1% | 0.6% | 6.4% | 5.1% | 2.5% | 3.2% | 17 of 20 | 85% | 2.9 |
071 | Rubber & rubber products | 11.3% | 12.7% | 11.0% | 0.3% | 3.5% | 2.8% | 0.6% | 2.7% | 14 of 20 | 70% | 4.2 |
072 | Plastic products | 8.6% | 14.8% | 24.1% | 0.7% | 7.2% | 5.7% | 3.1% | 3.3% | 16 of 20 | 80% | 2.6 |
082 | Millwork | 10.9% | 14.9% | 17.7% | 7.9% | 8.6% | 6.8% | 4.8% | 3.2% | 19 of 20 | 95% | 3.4 |
084 | Other wood products | 9.9% | 7.7% | 17.1% | 2.9% | 7.2% | 6.0% | 3.9% | 2.5% | 15 of 20 | 75% | 3.9 |
085 | Logs, bolts, timber, pulpwood & wood chips | 4.8% | 3.0% | 7.8% | 3.2% | 2.1% | 1.9% | 1.2% | 2.0% | 15 of 20 | 75% | 2.4 |
086 | Prefabricated wood buildings & components | 8.5% | 13.8% | 25.6% | 6.2% | 10.6% | 8.0% | 5.3% | 3.7% | 17 of 20 | 85% | 2.3 |
087 | Treated wood & contract wood preserving | 10.5% | 22.1% | 6.1% | 12.4% | 7.1% | 4.8% | 4.3% | 2.7% | 14 of 20 | 70% | 3.9 |
09 | Pulp, paper & allied products | 9.4% | 12.8% | 16.0% | 3.0% | 5.3% | 4.1% | 2.3% | 2.6% | 16 of 20 | 80% | 3.6 |
091 | Pulp, paper & prod., ex. bldg. paper | 9.2% | 12.5% | 18.6% | 1.6% | 4.9% | 4.2% | 2.3% | 2.8% | 15 of 20 | 75% | 3.3 |
094 | Publications, printed matter & printing material | 12.6% | 17.4% | 9.5% | 1.5% | 4.5% | 3.2% | 1.7% | 11 of 20 | 92% | 7.4 | |
103 | Metal containers | 19.1% | 27.0% | 21.6% | 0.7% | 6.9% | 6.4% | 2.7% | 3.2% | 14 of 20 | 70% | 6.0 |
104 | Hardware | 4.4% | 11.7% | 17.5% | 1.8% | 6.6% | 5.0% | 2.9% | 2.8% | 17 of 20 | 85% | 1.5 |
105 | Plumbing fixtures & fittings | 8.7% | 11.1% | 5.4% | 1.9% | 3.5% | 3.4% | 2.5% | 2.7% | 20 of 20 | 100% | 3.5 |
106 | Heating equipment | 7.1% | 14.5% | 21.3% | 0.4% | 8.3% | 6.4% | 4.1% | 4.0% | 20 of 20 | 100% | 1.7 |
107 | Fabricated structural metal products | 7.7% | 14.2% | 41.6% | 2.2% | 13.0% | 9.7% | 4.9% | 4.5% | 17 of 20 | 85% | 1.6 |
108 | Miscellaneous metal products | 6.6% | 10.9% | 14.0% | 0.7% | 5.1% | 4.3% | 2.1% | 2.4% | 17 of 20 | 85% | 3.2 |
11 | Machinery & equipment | 7.8% | 10.1% | 7.1% | 1.0% | 3.2% | 2.6% | 1.5% | 1.2% | 15 of 20 | 75% | 5.0 |
111 | Agricultural machinery & equipment | 10.1% | 16.2% | 14.6% | 1.0% | 5.8% | 4.3% | 2.8% | 2.9% | 20 of 20 | 100% | 3.7 |
112 | Construction machinery & equipment | 8.5% | 13.4% | 10.1% | 1.2% | 4.4% | 3.5% | 2.6% | 2.8% | 20 of 20 | 100% | 3.2 |
113 | Metalworking machinery & equipment | 6.7% | 9.5% | 7.3% | 0.7% | 3.1% | 2.7% | 1.9% | 1.8% | 18 of 20 | 90% | 3.6 |
114 | General purpose machinery & equipment | 12.2% | 15.3% | 10.1% | 1.8% | 4.6% | 4.0% | 2.8% | 3.0% | 20 of 20 | 100% | 4.3 |
1141 | Pumps, compressors, and equipment | 14.6% | 16.0% | 7.6% | 0.7% | 3.1% | 3.2% | 2.6% | 3.1% | 20 of 20 | 100% | 4.8 |
1142 | Elevators, escalators, and other lifts | 4.3% | 17.3% | 16.7% | 0.9% | 7.1% | 5.3% | 3.4% | 2.4% | 16 of 20 | 80% | 1.8 |
1143 | Fluid power equipment | 10.9% | 13.7% | 8.7% | 1.1% | 4.0% | 3.3% | 2.4% | 3.0% | 20 of 20 | 100% | 3.6 |
1144 | Industrial material handling equipment | 7.6% | 12.9% | 14.4% | 1.7% | 5.6% | 4.6% | 3.4% | 3.3% | 19 of 20 | 95% | 2.3 |
1145 | Mechanical power transmission equipment | 12.3% | 13.7% | 8.0% | 1.7% | 3.8% | 3.4% | 2.3% | 3.1% | 18 of 20 | 90% | 4.0 |
1146 | Scales and balances | 7.4% | 9.0% | 11.9% | 1.1% | 4.8% | 5.3% | 3.9% | 2.9% | 20 of 20 | 100% | 2.5 |
1147 | Air purif. equip. & indust./commerc. fans/blowers | 9.2% | 10.1% | 9.6% | 1.8% | 4.9% | 4.0% | 2.9% | 2.8% | 19 of 20 | 95% | 3.2 |
1148 | Air conditioning and refrigeration equip | 19.0% | 24.9% | 14.7% | 2.6% | 6.7% | 5.4% | 3.3% | 2.8% | 19 of 20 | 95% | 6.8 |
114902 | Metal valves, except fluid power | 12.3% | 14.2% | 4.9% | 2.8% | 3.2% | 3.6% | 3.2% | 4.1% | 20 of 20 | 100% | 3.0 |
114903 | Metal pipe fittings, flanges, and unions | 14.1% | 16.0% | 14.4% | 13.6% | 9.5% | 7.8% | 3.5% | 3.4% | 15 of 20 | 75% | 4.1 |
116 | Special industry machinery & equipment | 8.4% | 10.0% | 11.6% | 2.1% | 5.1% | 3.7% | 2.3% | 2.0% | 19 of 20 | 95% | 3.6 |
118 | Miscellaneous instruments | 7.6% | 9.2% | 3.5% | 1.3% | 2.3% | 2.1% | 1.8% | 1.8% | 20 of 20 | 100% | 4.2 |
119 | Miscellaneous machinery | 4.9% | 6.6% | 4.1% | 0.8% | 2.1% | 1.8% | 1.1% | 1.8% | 17 of 20 | 85% | 4.5 |
12 | Furniture & household durables | 7.1% | 9.3% | 10.9% | 1.6% | 4.7% | 3.9% | 2.4% | 2.1% | 20 of 20 | 100% | 3.0 |
121 | Household furniture | 7.1% | 10.0% | 13.3% | 0.9% | 5.4% | 4.3% | 2.7% | 2.5% | 19 of 20 | 95% | 2.6 |
122 | Commercial furniture | 10.0% | 12.0% | 12.5% | 1.9% | 5.5% | 4.8% | 2.9% | 2.7% | 18 of 20 | 90% | 3.4 |
124 | Household appliances | 8.5% | 10.5% | 8.3% | 1.9% | 4.4% | 3.7% | 1.9% | 1.3% | 12 of 20 | 60% | 4.5 |
126 | Other household durable goods | 5.0% | 6.6% | 9.8% | 2.6% | 4.5% | 3.2% | 2.1% | 1.8% | 20 of 20 | 100% | 2.4 |
13 | Nonmetallic mineral products | 12.2% | 13.8% | 7.8% | 2.1% | 3.8% | 3.5% | 3.0% | 3.3% | 19 of 20 | 95% | 4.0 |
131 | Glass | 6.6% | 8.9% | 6.5% | 3.3% | 3.7% | 3.0% | 2.8% | 1.5% | 15 of 20 | 75% | 2.4 |
132 | Concrete ingredients & related products | 11.9% | 11.9% | 4.1% | 3.8% | 3.7% | 3.7% | 3.6% | 3.8% | 19 of 20 | 95% | 3.3 |
133 | Concrete products | 12.5% | 15.4% | 8.4% | 2.7% | 4.6% | 4.0% | 3.6% | 3.5% | 17 of 20 | 85% | 3.5 |
134 | Clay construction products ex. refractories | 5.8% | 7.2% | 5.4% | 2.0% | 2.9% | 1.9% | 1.5% | 1.3% | 15 of 20 | 75% | 3.8 |
135 | Refractories | 10.3% | 11.1% | 7.2% | 0.5% | 4.3% | 3.8% | 2.7% | 3.5% | 18 of 20 | 90% | 3.8 |
136 | Asphalt felts & coatings | 16.4% | 14.9% | 11.7% | 2.3% | 4.2% | 5.1% | 1.9% | 4.8% | 11 of 20 | 55% | 8.7 |
137 | Gypsum products | 16.5% | 18.6% | 20.2% | 3.7% | 6.1% | 6.0% | 6.9% | 4.4% | 15 of 20 | 75% | 2.4 |
138 | Glass containers | 10.9% | 12.4% | 6.8% | 1.7% | 3.7% | 2.8% | 2.1% | 2.7% | 20 of 20 | 100% | 5.2 |
139 | Other nonmetallic minerals | 13.3% | 15.1% | 8.4% | -0.5% | 2.6% | 2.5% | 1.9% | 3.3% | 16 of 20 | 80% | 6.9 |
14 | Transportation equipment | 3.7% | 5.1% | 3.9% | 0.9% | 1.7% | 1.5% | 1.3% | 1.4% | 19 of 20 | 95% | 2.7 |
141 | Motor vehicles & equipment | 3.7% | 5.3% | 4.6% | 0.7% | 1.7% | 1.4% | 1.3% | 1.0% | 16 of 20 | 80% | 2.9 |
142 | Aircraft & aircraft equipment | 3.7% | 4.3% | 1.6% | 1.3% | 1.4% | 1.3% | 1.4% | 2.2% | 19 of 20 | 95% | 2.6 |
143 | Ships & boats | 4.6% | 6.1% | 5.2% | 1.3% | 3.2% | 2.4% | 1.8% | 2.7% | 20 of 20 | 100% | 2.6 |
149 | Transportation equipment, n.e.c. | 5.7% | 9.9% | 10.2% | 0.5% | 3.7% | 3.3% | 2.0% | 1.7% | 16 of 20 | 80% | 2.8 |
15 | Miscellaneous products | 7.4% | 9.0% | 6.3% | 2.8% | 4.3% | 3.6% | 2.7% | 2.5% | 18 of 20 | 90% | 2.8 |
151 | Toys, sporting goods, small arms, etc. | 7.7% | 9.7% | 9.7% | 0.3% | 4.8% | 2.9% | 2.0% | 1.7% | 16 of 20 | 80% | 3.8 |
152 | Tobacco products, incl. stemmed & redried | 9.1% | 10.7% | 7.7% | 6.4% | 6.8% | 6.3% | 5.5% | 4.3% | 18 of 20 | 90% | 1.7 |
153 | Notions | 6.4% | 13.5% | 12.6% | 0.6% | 4.8% | 3.6% | 2.2% | 3.1% | 18 of 20 | 90% | 2.9 |
154 | Photographic equipment & supplies | 8.5% | 10.3% | 7.2% | -0.1% | 4.7% | 3.4% | 2.0% | 1.5% | 12 of 20 | 60% | 4.3 |
155 | Mobile homes | 8.3% | 15.0% | 30.1% | 8.6% | 15.4% | 11.0% | 6.8% | 5.2% | 20 of 20 | 100% | 1.2 |
156 | Medical, surgical & personal aid devices | 3.3% | 3.8% | 1.3% | 1.1% | 1.3% | 1.2% | 1.0% | 1.1% | 20 of 20 | 100% | 3.4 |
157 | Other industrial safety equipment | 7.4% | 9.2% | 7.0% | 2.9% | 3.0% | 2.0% | 2.1% | 1.8% | 18 of 20 | 90% | 3.5 |
159 | Other miscellaneous products | 12.0% | 14.9% | 8.7% | 2.1% | 5.4% | 4.0% | 2.2% | 2.3% | 18 of 20 | 90% | 5.4 |
Instructions:
Note: LIFO is adopted on a prospective basis & LIFO tax savings accrue beginning in the year of the change. Prior period benefits can NOT be retrospectively recaptured. 20 year cumulative taxable income reduction & after-tax cash savings shown in calculator are for analysis purposes only & is provided to project the potential tax savings from LIFO that could occur over the next 20 years based on your current year inventory balance at cost & the historical inflation rates.
Is your company considering electing LIFO? Get a free benefit analysis from LIFOPro! We’ll build a comprehensive case study delivered to you in the form of a report containing everything you need to make an informed decision while considering a LIFO election. This complimentary, comprehensive analysis is only available from the experts at LIFOPro. Submit your LIFO benefit analysis questionnaire today by clicking the button below!
LIFO Benefit Analysis Questionnaire
How to Easily Implement LIFO
How LIFO Works
Get a Complimentary LIFO Election Benefit Analysis today!
Sign up today to receive industry news & promotional offers from LIFO-PRO